Slope of Hope Blog Posts

Slope initially began as a blog, so this is where most of the website’s content resides. Here we have tens of thousands of posts dating back over a decade. These are listed in reverse chronological order. Click on any category icon below to see posts tagged with that particular subject, or click on a word in the category cloud on the right side of the screen for more specific choices.

The Fibonacci Trio

By -

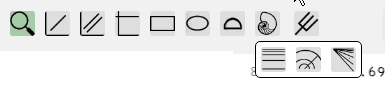
SlopeCharts has had Fibonacci Retracements ever since it was launched last year. Today, however, we have tripled the number of Fibonacci tools, adding both the Arc and the Fanlines. The icon still looks the same, but now when you click the seashell, you will see three tool choices.

To use any Fibonacci tool on a chart, choose the seashell icon:

fibbutton

Three tool choices appear which are, from left to right, price retracements, arcs, and fanlines. Click any of the three to choose that tool (or click the seashell again to deselect).

FibChoices (more…)

Seeing the Components

By -

To my way of thinking, there are three kinds of people in the world:

  1. SlopeCharts users;
  2. Recalcitrant infidels who insist on using inferior charting platforms;
  3. Those gentle souls who simply need a light to see their way to SlopeCharts

It is this third group I am particularly addressing with this post, since there are so many features in the product, it’s easy to lose sight of all there is to use and enjoy.

Today I am having an exceptionally good day with my Dow Utility put options. It occurred to me that I wasn’t acquainted with the 15 component stocks of the Utilities, and I was curious to see the stocks which comprised the index itself. SlopeCharts easily solves this problem like so: (more…)

SlopeCharts Now Has Events

By -

SlopeCharts can display for you three distinct time-based events on top of the price chart itself. Pressing Ctrl-E on the keyboard will toggle the display of these events on and off, and by pointing to any of the letters signifying the event you can get more details on that specific instance.

eventmenu

The three events displayed are as follows:

Earnings, designated by the letter “E”, which typically are announcements that happen once per quarter for any public company. Moving over the “E” shows you the date of the earnings announcement and whether or not the news was came before or after normal trading hours. (more…)

Descriptions

By -

There’s a bit of a running gag between me and my Tastytrade viewers, because at least once a week I’ll mention a stock in which I have a position and that “I have no idea what they do.” Even, as a chart purist, I don’t care what any company does, folks will always write me and tell me specifically what a given organization does.

Well, we’ve made a bit of an improvement in the SlopeCharts summary page, which used to look like this:

before (more…)