As development winds down on the new Slope site (since we’re almost ready to launch), I’m able to commit more hours to SlopeCharts again. Today’s improvement is simple but something I’ve been really wanting: keyboard shortcuts to toggle volume on/off and earnings on/off. ProphetCharts used to have this, and now SlopeCharts does do. Just press Ctrl-Spacebar to toggle volume on and off, and Ctrl-E to toggle earnings dates on and off. The video below shows the old way (slow) and the new way (instant).
Slope of Hope Blog Posts
Slope initially began as a blog, so this is where most of the website’s content resides. Here we have tens of thousands of posts dating back over a decade. These are listed in reverse chronological order. Click on any category icon below to see posts tagged with that particular subject, or click on a word in the category cloud on the right side of the screen for more specific choices.
SlopeCharts Tweaks
I’m pleased to let SlopeCharts users know there are a couple of minor but helpful improvements we just made.
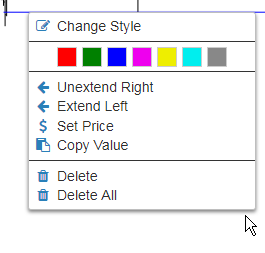
First, we’ve expanded the number of “quick pick” colors. I use this feature constantly, because it’s so much faster than going into the color palette. It lets you instantly change the color of any drawn object. Just right-click on anything you want to change and pick the color you like.
Using the SlopeCharts Earnings Mode
From The Director: Tim has graciously offered to work together with me to develop charting tools that can aid the testing and design of new pre and post earnings approaches in using options to make profitable investing strategies.
Other services have benefited from using past data (both options and underlying data) to generate probabilities for certain movements in underlying stock. We can utilize these probabilities to generate option strategies, backtest the same strategies, and offer a framework wherein we trade these strategies prospectively, which can aid the keen investor.
None of what we discuss here should be construed as a trade recommendation or advice, but rather look at this tutorial as a tool you can use to improve your trading. (more…)
Expiration Charts!
I have an extremely cool new feature for you SlopeCharts folks out there: earnings dates charts. This will be of particular interest to you options traders. Allow me to explain………..
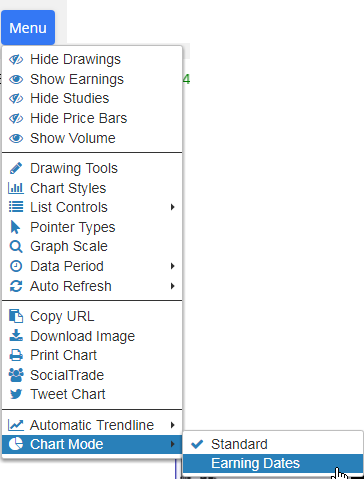
What we’ve done is merged together historical stock data with earnings announcements so you can see how a stock behaves as it approaches its earnings day. By default, we show you every day for twenty days in advance of earnings, as well as the day of and the day after earnings (you can change how many days via a dropdown). Using it, as with all things SlopeCharts, is simple. Just choose the Earnings Dates item from the new Chart Mode menu item:
SlopeCharts In Action
I had a recent experience with Slopecharts that I wanted to share, since it is illustrative of how some very simple functions built into the program can produce powerful results.
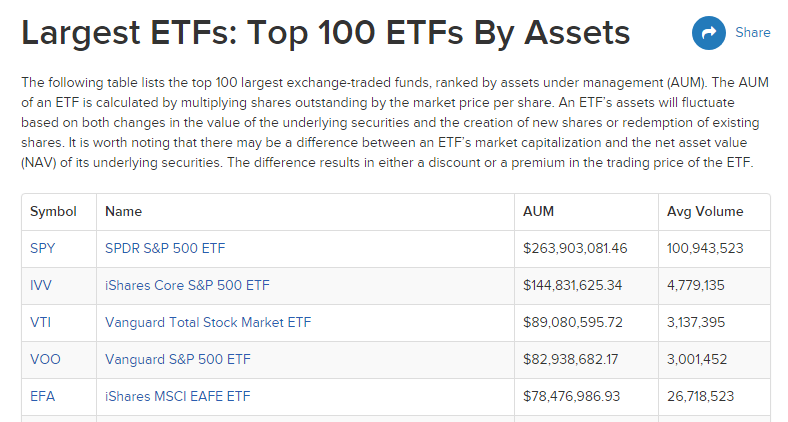
I have a watch list called ETFs which contains 80 symbols of popular ETF symbols like SPY, TLT, QQQ, and so forth. Because these instruments have been so important to my trading, I wondered to myself if there were other interesting symbols that I wasn’t yet following.
One Google search later, I was on a page that had the biggest 100 funds, and I simply copied this table text and pasted it into Excel.