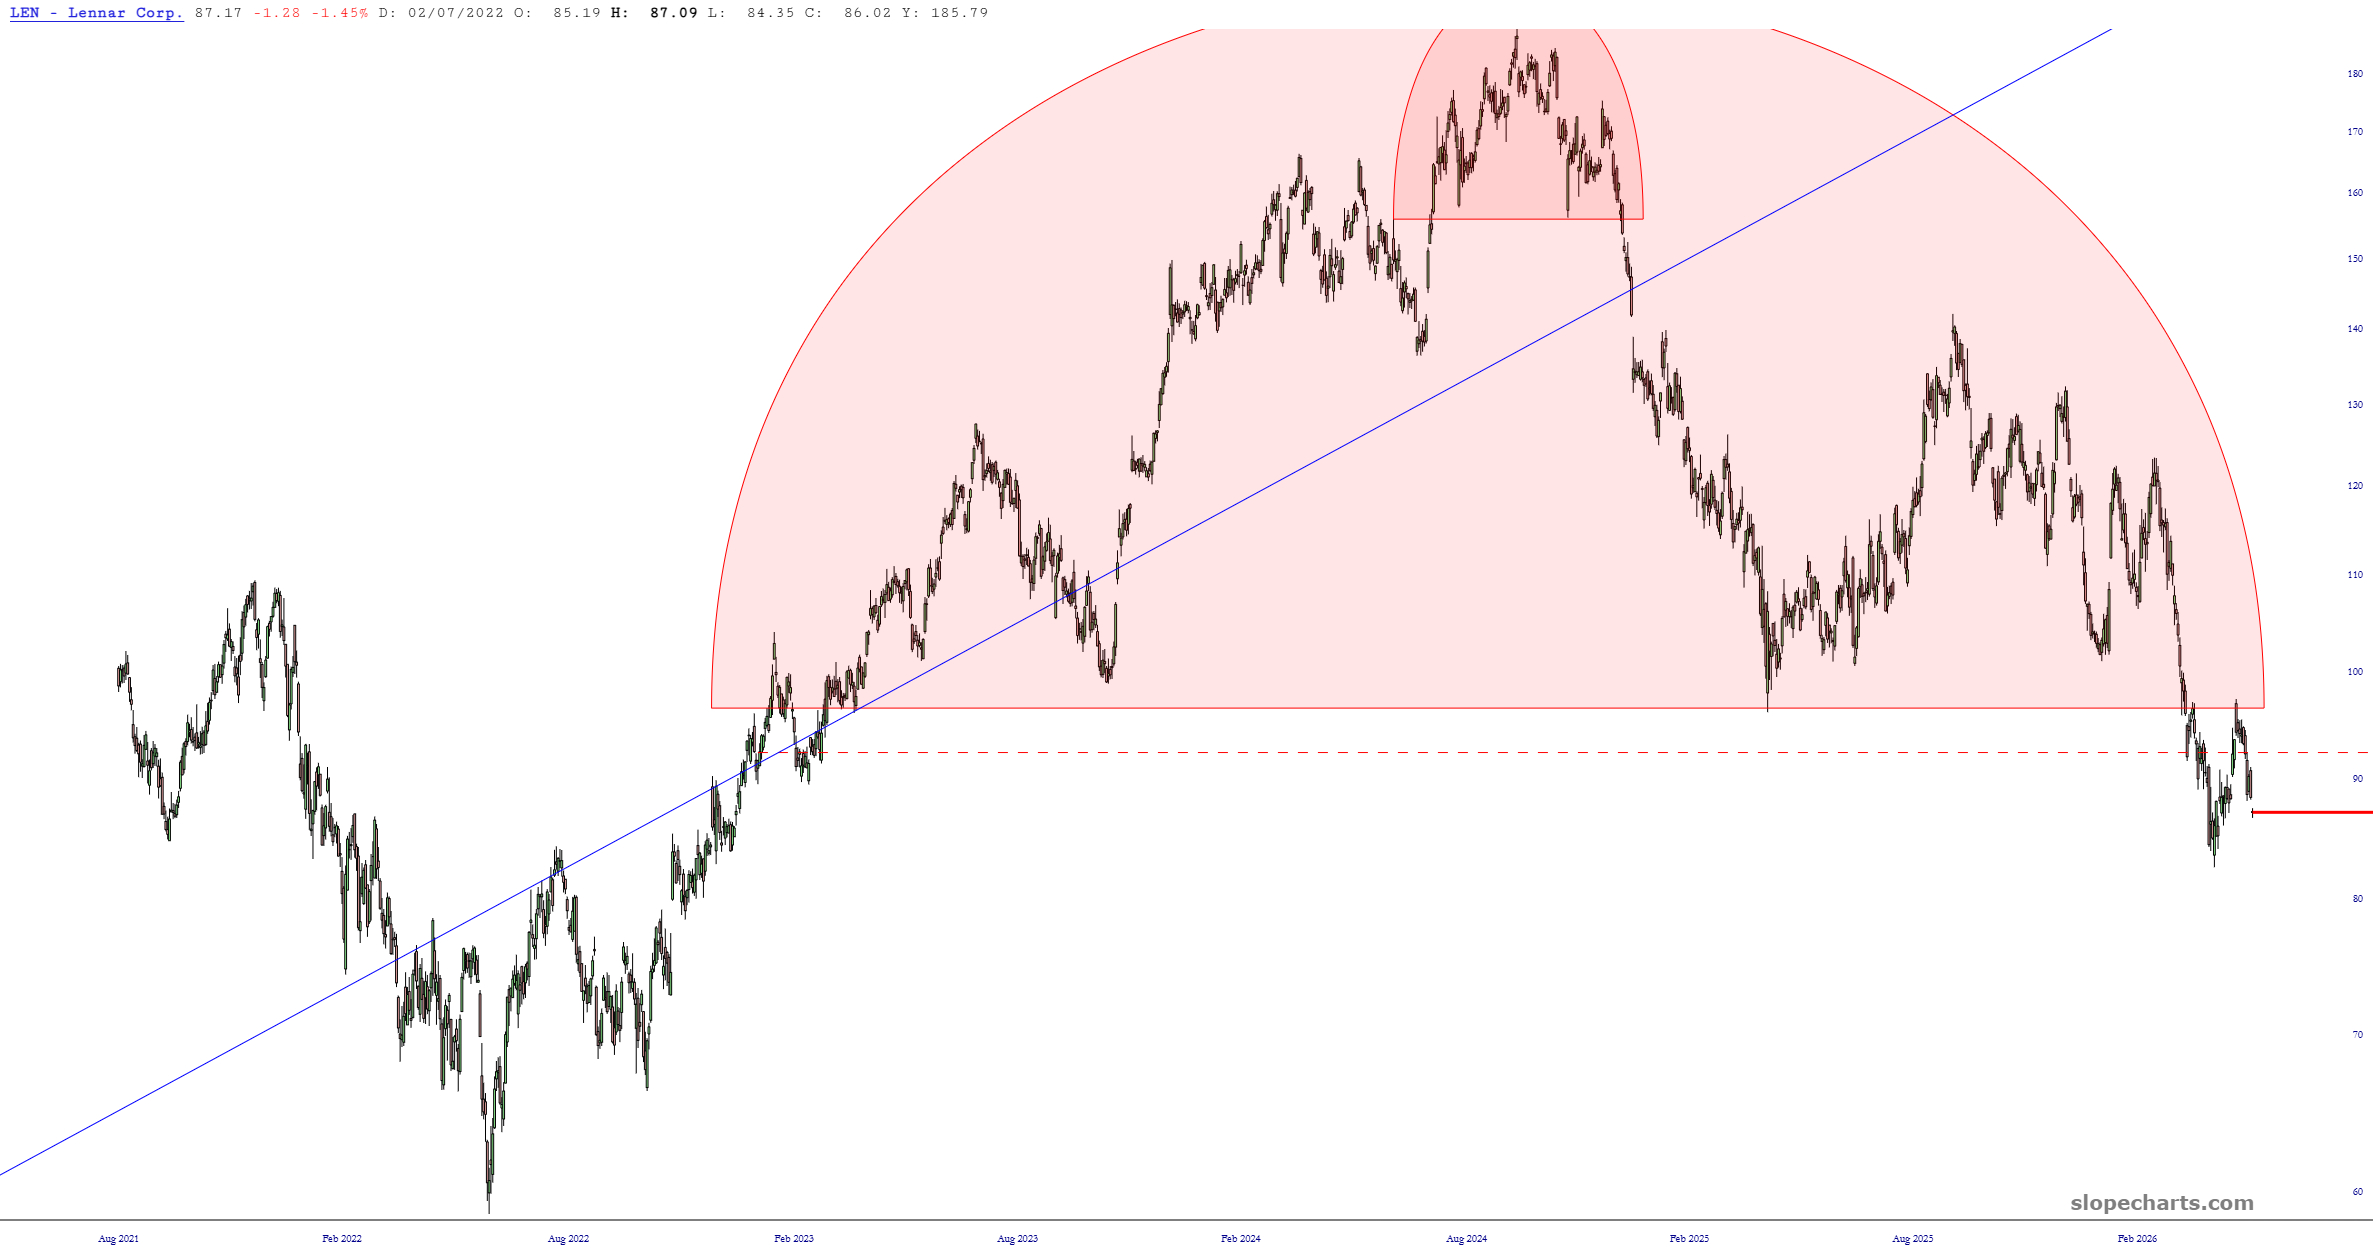
This is a follow-up to my post describing my bearishness against homebuilder Lennar (LEN). This massive topping pattern is behaving itself beautifully:
When I went to bed Sunday night, I figured it was virtually certain that I’d need to do a post on Monday morning that I was giving up on my Bitcoin analogy (and, therefore, short position). It was up thousands of dollars and seemed in no mood to slow down.

I stumbled upon this video on Sunday morning and found it to be interesting and informative.
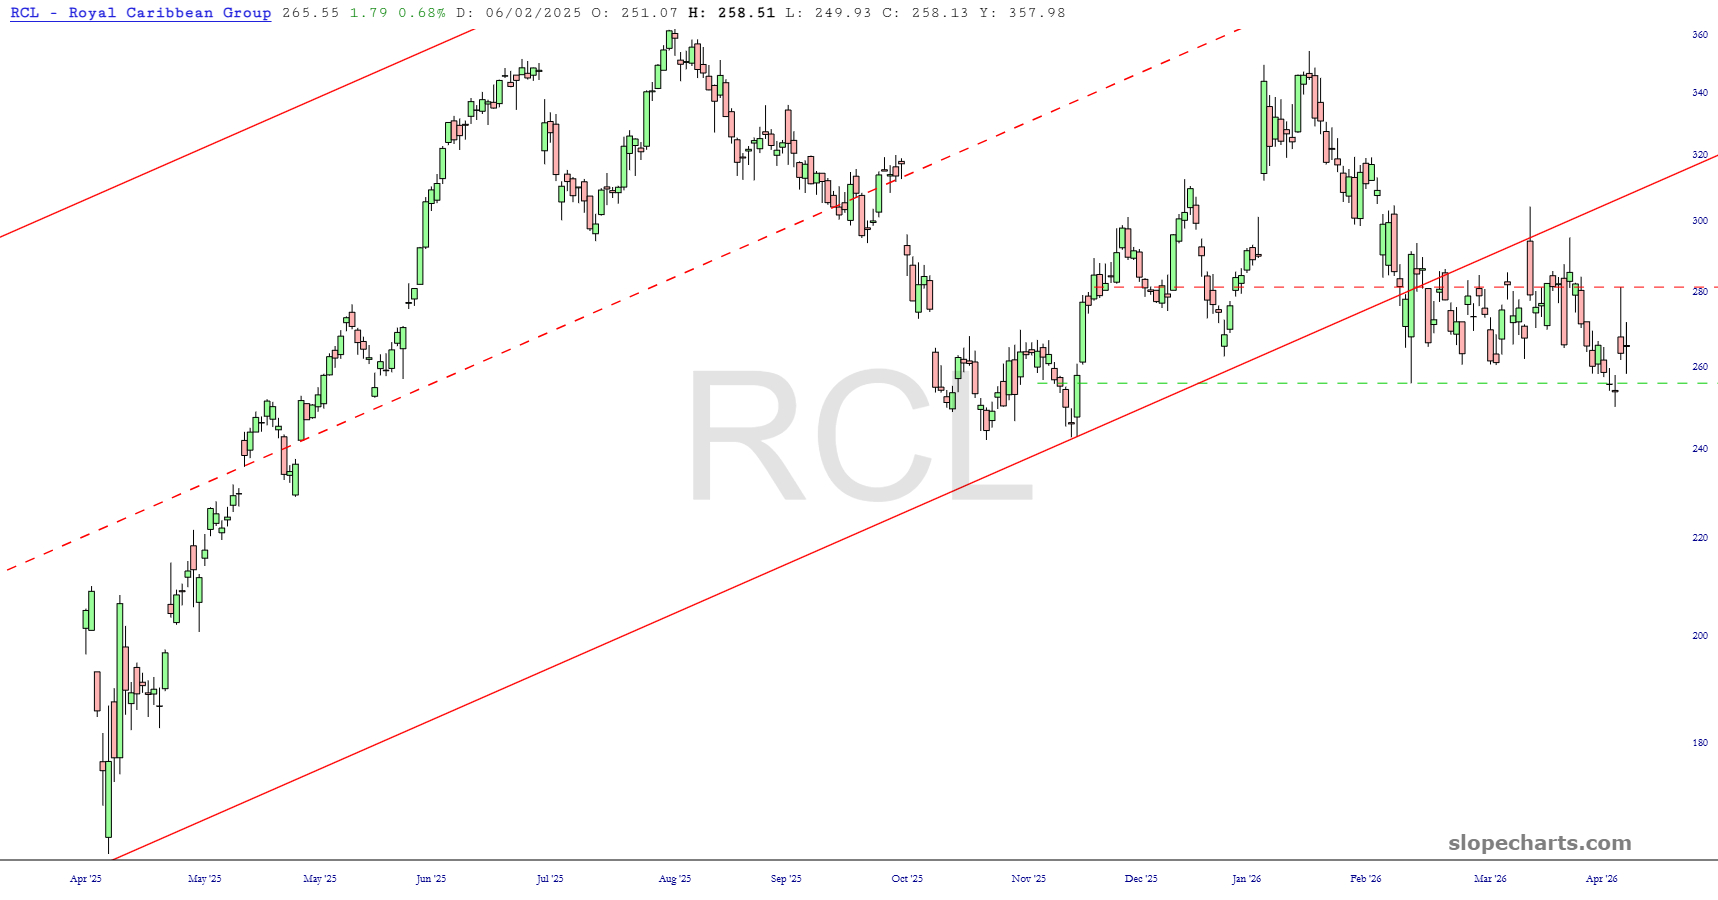
Preface to all four parts: my Bear Pen has forty components (that is to say, there are forty equity charts that are intriguing short-sale candidates, most of which I've already shorted). I have broken them up into four equal parts. Here is this set of ten, zoomed in to the most relevant recent portion; click on any chart for a much larger version: