Slope of Hope Blog Posts

Slope initially began as a blog, so this is where most of the website’s content resides. Here we have tens of thousands of posts dating back over a decade. These are listed in reverse chronological order. Click on any category icon below to see posts tagged with that particular subject, or click on a word in the category cloud on the right side of the screen for more specific choices.

Those Bearish Bloggers

By -

Just for the heck of it, I went to Google today and typed "Bearish Blogs" – – and was surprised to see Slope didn't even show up once on the first page. In fact, there wasn't a single reference to any useful blog – – – just a bunch of fairly random articles. The topmost link was this post by Paul Kedrosky from nearly three years ago, which is an article he wrote lamenting how dour bearish bloggers were. He said……

…..their commenters in an echo chamber muttering darkly about canned food, plunge protection teams, a bullet-less Fed, and on and on. It's bleak and apocalyptic at the best of times, and now it's a relentless and somewhat bizarre mixture of Calvinist moralizing and noisy negative-triumphalism.

Wow, do you think he's talking about us? Anyway, I've marked the point where he was talking about how loony folks like us were being:

0224-negative

Peering Over the Cliff (by Springheel Jack)

By -

Well we had a sharp drop on SPX yesterday, and we reached the bottom of the
rising channel on SPX, though in the process it evolved slightly into a
broadening ascending wedge:

100223C SPX 60min Channel and Wedges

There is a possible IHS forming, but it would have been a lot stronger
if it had broken key resistance in the 1113 area and gone through to
hit the blue dotted trendline on the SPX daily. Personally I don't particularly rate sloping IHS patterns in any case:

100223 SPX Daily Trendlines and SR Levels

EURUSD dropped to good support on the bottom trendline of the gently declining channel of recent days:

100223 EURUSD Channels 

I think that we could well fall from here, and if we break Tuesday's LOD then I will be switching to a much more bearish view, but in the short term we could well bounce here. We hit channel support on SPX and EURUSD and bounced, and we didn't hit the blue dotted trendline on the SPX daily that was the obvious target for the upswing. We may now return to hit it.

The SPX just doesn't look quite cooked to my eye. We missed that trendline, I'm watching some developing patterns, like the H&S patterns on KO and AAPL, that don't look finished on a time basis, we've seen a disconnect between SPX and EURUSD in recent days, we all know wave 2's can retrace much further than 61.8%, and there is a significant turn date coming next week. We may not be quite there yet.

I may just be too cautious nowadays, impatient bears have had a difficult time recently and too many have crashed and burned as they shorted a market that wasn't ready to fall yet.

One of my favorite films is the Assassination Bureau with Oliver Reed. There's an increasingly morose russian character in it that raises a glass regularly during the film, as many of the other characters meet untimely ends, and toasts his 'absent friends'. That is what it has felt like sometimes being a bear blogger since the bottom almost a year ago.

Better to risk being late than be early to this particular party I suspect.

29 Stocks Worth Shorting w/ Stops (by Ryan Mallory)

By -

Okay Folks – Here is my labor of love – and let me tell you it is some major labor having to type out all these symbols, company names and stop-losses into a post for you. But I know that it is a huge help for many of you, and that's why I do it.

The last time I posted all of my short candidates was about two weeks ago, and believe it or not, I'd say about half of those are stocks that I still like. You'll see a number of newcomers, but most of the stocks that I provided you with with a few weeks ago has still managed to hold their own despite the hard push the bulls have made of late to get us out of this current downtrend that is in play – Alcon (ACL) is a perfect example.

So below you have 29 stocks that I believe are excellent candidates to initiate short positions in. I may look to add a few more to my portfolio in the coming days as I already have CSCO, JPM, AGN and GPS.

1. Avon Products (AVP) – 32.35
2. JPMorgan Chase (JPM) – 42.30
3. Allergan (AGN) – 61.33
4. Goldman Sachs (GS) – 167.20
5. Hartford Financial (HIG) – 26.91
6. Amazon.com (AMZN) – 127.60
7. Stone Energy (SGY) – 18.01
8. Cisco (CSCO) – 24.83
9. Rambus (RMBS) – 24.01
10. Sba Communications (SBAC) – 36.11
11. Neenah Papers (NP) – 15.87
12. Alcon (ACL) – 160.80
13. Temple Inland (TIN) – 19.70
14. Gap (GPS) – 20.50
15. California Water Service (CWT) – 37.75
16. Lowes (LOW) – 23.55
17. Noble Energy (NE) – 44.25
18. Public Storage (PSA) – 83.20
19. Empire District Electric (EDE) – 19.05
20. Occidental Petro (OXY) – 83.15
21. Morningstar (MORN) – 47.45
22. Vodofone (VOD) – 22.91
23. Magellan Midsreams (MMP) – 45.01
24. Stec (STEC) – 15.26
25. Reliance Steel & Alum (RS) – 46.25
26. SPDRs Financial (XLF) – 15.01
27. Georgia Gulf (GGC) – 17.21
28. Lindsay (LNN) – 42.45
29. SPDR Gold (GLD) – 110.25

Originally Posted on my blog at SharePlanner.com

Hunting for Volatility Squeezes (by Leisa)

By -

Here's a re-tread post of mine from 11/05/09 that might serve as a useful follow on to my post on how to ride (not shoot) your winners.  Paying to volatility has helped my trading tremendously.  I'll dig out some other posts on this matter to if there is sufficient interest.


While I consider myself a serious student of the market, I don’t
call myself a trader. But I do trade and have done so with reasonable
success. This year, I incorporated a new dimension into my trading:
volatility. Simply put, I’m buying when volatility is low, and I’m
selling when volatility is high—and I’m doing so on charts that appear
to be good candidates for long entries. I’ve not used it for short
positions.

The point of this post is not to go into an in-depth
analysis regarding volatility, but rather to introduce to you this
concept and provide some actual examples. I think that you will have
fun experimenting with it. I'll mention, too, that John Carter uses
this in Mastering the Trade
. But I cobbled it together for myself (after first experimenting with
Donchian Channels) before reading his book. I believe it to be a book
that belongs on most traders bookshelves.

Method: There are two technical indicators deployed: The Keltner Channel and Bollinger Bands.
Like most indicators, both of these are measurements that are
incorporating time and range of price movement that the user defines.
For this method, I am specifically hunting for stocks that have the
Bollinger Band nested INSIDE the Keltner Channel. Carter notes this as
quiet periods…"period of reduced volatility and signals that the
market is taking a significant breather, building up steam for its next
move." For the Bollinger Bands, he uses 20 and 2, and for the Keltner
Channels, 20 and 1.5. I started out using 10, as a parameter for both,
and I've not changed it. But I wanted to share the parameters a
vocational (Carter) rather than an avocational (me) trader utilized.

Now
for four charts. (Click to make larger!) I want to give a brief preamble. While many of you are
technical traders, I mix macro fundamentals and sector fundamentals
into my work. It's my quirk, and it works for me because of my learning
style and my background. It points me in the direction I want to look
and helps me assess risk.

The first three stocks were actual
positions. I've been trading Chinese stocks long before it was
fashionable to do so. The floats and price range may not suit many
here, but the concept can be applied to any stock. It's worth noting
that because this market fell hard, there were lots of attractive
candidates in these long bases. The last is a contemporary example.
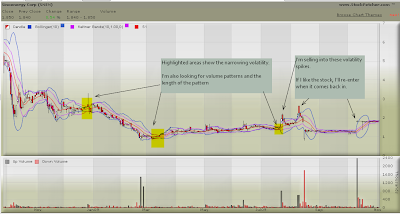
Here's
SNEN. I liked them because they were in the compressed natural gas
space in China (engine conversion units and stations). I also knew that
they had a small balance sheet problem–so I took my money and ran.
This stock is an example where I entered, sold on the volatility spike.
Re-entered and re-sold on the volatility spike. No third time charm on
this one because of the risk on the balance sheet. They are being
bought by a shareholder.
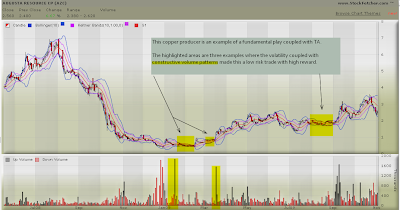

Second
is AZC. This stock is again a combination of fundamental (copper–they
will supply 10% of the copper when one of their Rosemont site comes on
board) and TA.

HPJ is another one. This one broke out along with the other lithium-ion battery producers.

Here's the stock screen that I use on StockFetcher (XX's signify variables that suit your trading style–you see I'm no stranger to the boneyards):

Close is above (XX)
AND Volume is greater than (XXXX)
AND Upper Bollinger(10) is less than Upper Keltner Band(10)
AND lower Bollinger(10) is greater than Lower Keltner Band(10)
and add column Bollinger %B(10,2) (I use this to order candidates from lowest band width to highest)

To
put this post together, I didn't have to cherry pick through my stock
entries to provide examples for you. It has proved to be a high
probably trade and a richly rewarded trade. I will tell you that the
hardest thing to do is to sell into the volatility explosion. And we
know that doing the hard thing is often the right thing! Naturally, any method you deploy must fit with your time, money and
risk/reward parameters.