Slope of Hope Blog Posts

Slope initially began as a blog, so this is where most of the website’s content resides. Here we have tens of thousands of posts dating back over a decade. These are listed in reverse chronological order. Click on any category icon below to see posts tagged with that particular subject, or click on a word in the category cloud on the right side of the screen for more specific choices.

JSTFR Still I Think (by Springheel Jack)

By -

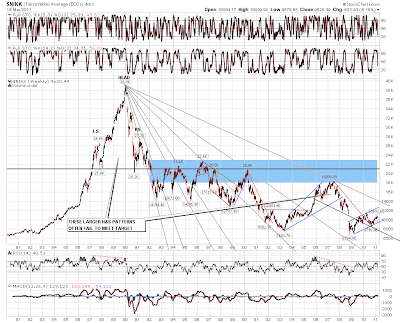
There was another strong bounce yesterday and many have called the bottom again here, which has been the case every time there has been a bounce since this correction started. There are no strong indications that the bottom has been made yet though, and I'm leaning towards seeing more downside on balance, though I think the bulk of the correction is behind us now, if this is just a correction which seems likely. I've had a close look at the SPX daily chart since this cyclical bull started in March 2009, and apart from the low in July 2009 every significant bottom has been signalled with positive divergence on the daily RSI, which we're not seeing yet. The big lows in July 2009, and in Feb, July and November 2010 were all also at very significant support levels, and while 1255 is a significant level, the obvious target is at the 1220-1230 level, and that has not yet been reached. Here's the SPX daily chart for the bull market so far:

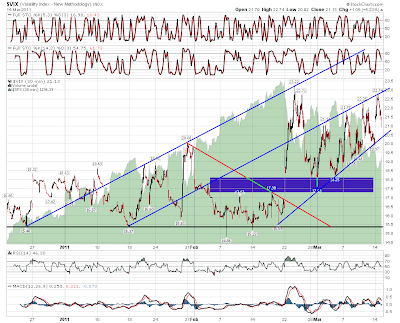
Vix is looking interesting. I called the target for Vix a bit high yesterday, as it was a little hard to pin down on the chart, but Vix rose exactly to my upper resistance trendline and reversed there:

On the daily chart Vix moved above the daily BBs for the second time in this correction and that does look significant, as Vix may now be setting up to give a buy signal. These have a reasonable track record at preceding significant bounces, and I'll be watching to see whether this develops into a Vix buy signal:

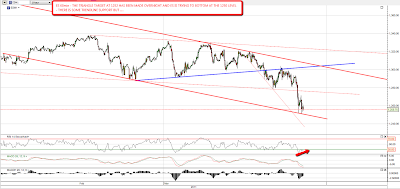
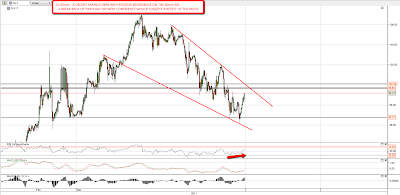
With both Yen and USD looking seriously unwell, the remaining flight to safety trade still running is to treasuries, and I posted the IHS on 30yr treasuries yesterday. Here's the inverse of that on the yields chart and you can see where I'm thinking yields are headed here. We're still some way from the obvious target and that is supporting the case for more equities downside here:

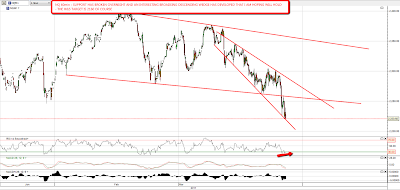
EURUSD is continuing to struggle at 1.40, but I'm not seeing much to suggest that USD will do more than trade sideways during this correction. Unless EURUSD can break current rising channel support, now in the 1.382 area, then I'm expecting EURUSD to continue moving up after the equities correction is finished:

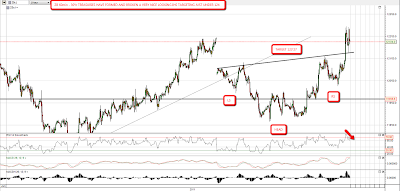
Copper is looking divergently strong here, and is now retesting the broken H&S neckline in the 425 area. Copper's been acting as a decent lead indicator recently, and a break up with conviction would boost the bull case considerably:

Oil is stabilising as pro-democracy unrest in the Middle East is being suppressed. I'm expecting a bounce back to retest 100 and an H&S may be forming that may then take oil back into the 80s. A break back up through 100 would suggest a retest of the recent highs:

I'm still of the view that this is just a correction and I'm looking for a decently signalled low here, though that doesn't always happen. There are some signs that the correction is drawing to a close, but not enough to think that it is over yet. I'm still leaning bearish but would be concerned if ES breaks back up over 1285 with conviction.  I'm also watching the 425 level on copper as a possible directional indicator.

For Whom the Bell Trolls

By -

It seems that my declaration of a bull trap being set on March 11th – which was not only right, but Ungodly Right – attracted more than just derisive abuse from other financial blogs. It yielded hateful emails like this one, which I got shortly after posting my prediction:

——————————————————————-


Tim,
 
I'm sorry, but you obviously are not much of a Trader.
 
Anyone looking at the ES chart that you posted that has been an active trader over the last 20 years would understand that we are in a classic A-B-C measured move where C=A at 1282.50
 
You just don't get it.
Oh and by the way, keep shorting those $5.00 stocks.
Seems like a great use of your trading capital.
 
LOL!
 
Larry  
——————————————————————-
I wonder how much this "Larry" puke is LOL-ing now. What a great guy, huh?
It's amazing the odd ways my efforts on this blog get rewarded by the trading public.

Juggling Angry Badgers (by Springheel Jack)

By -

People often forget that officials lie as a matter of course, and that open government is, in consequence, always something of a joke. One of my favorite quotes is from a film or documentary about Watergate where an official was answering questions from a politician trying to establish who first suggested that there should be a cover-up. The official replied that 'no-one ever suggested that there might not be a cover-up', and I expect that was exactly right. Yesterday there were two stories coming out of Japan about the potential nuclear accident there. The official version was that everything was well under control, and the second was from outside experts saying that flooding reactors with seawater was a last ditch desperation measure that was most unlikely to succeed. No prizes this morning for guessing which assessment was correct.

That's worth remembering when we hear soothing statements from central bankers about the desirability of obviously reckless money printing and debt accumulation, or when they make statements about inflation remaining subdued against a backdrop of obviously accelerating price inflation. We should always remember the image of Comical Ali (Mohammed Saeed al-Sahaf), the hapless Iraqi Information Minister, making statements about the US forces being crushed in the late stages of the invasion of Iraq, with US tanks rolling into Baghdad clearly visible behind him as he spoke. All of these officials see managing expectations and soothing fears as their job, none of them seek to disseminate the truth. Comical Ali was perfectly representative of officials making statements to the press, and it has always been so. Doubtless one of Nero's officials was dismissing reports of Rome burning as scaremongering as Nero fiddled and Rome burned behind him. As a breed they would have to work hard on improving their reputation for honesty to compete with a four year old child in search of chocolate.

Looking at the markets this morning in the wake of reports that the stricken nuclear reactor in Japan is now releasing large amounts of radiation to atmosphere. I see that the Nikkei is down over 10% overnight, and there have also been heavy falls in other developed equity markets. Some nice technical lows are developing at support, but a friend of mine remarked this morning that he'd rather juggle angry badgers this morning than play the open, and I'm inclined to agree. It wouldn't take a lot to see a flash crash situation develop here and using stops looks particularly important today.

On ES the triangle target at 1252 was made overnight and ES is trying to make a short term low in the 1250 area. That might succeed short term, though I'm still expecting a test of the 1220-30 area before this correction ends:

NQ fell through the 2250 support level, and retested it before going lower. That looks ominous and I'm hoping that a broadening wedge I've identified on the NQ chart holds today. The H&S target is 2160 of course, which would fit well with my ES target in the 1220-30 area, so I'm expecting more downside regardless of any bounce here:

Looking at 30yr treasuries this morning I'm seeing strong signs that there will be more upside. Significant resistance has broken overnight and a very nice IHS has formed over the last few days with a target just under 124:

One big question this morning is whether the USD has enough credibility left to assume a traditional role as a flight to safety target with treasuries. Yen would normally be the third flight to safety trade of course, but probably not this time for obvious reasons. Looking at the EURUSD chart there is some sign that EURUSD may have made a double-top at 1.40, but we'll have to see a conviction break of 1.38 to confirm weakness:

The Nikkei is down over 20% in the last few days and is starting to look interesting. The current rising channel on this long term chart has broken overnight and I'm seeing strong trendline support in the 7700 area:

I posted a Vix 30 min chart the other day and the trendlines I drew on it have been holding beautifully. I'll be looking to see whether Vix breaks overhead resistance this morning and if it does I'll be expecting a move to the next resistance trendline in the 27 area:

Overall I'm leaning towards a bounce here in the context of further falls later on, but it wouldn't take a lot to push this over the edge this morning so any longs should be cautious. The Ides of March are not always trouble free, as I'm sure Julius Caesar would agree.