Slope of Hope Blog Posts

Slope initially began as a blog, so this is where most of the website’s content resides. Here we have tens of thousands of posts dating back over a decade. These are listed in reverse chronological order. Click on any category icon below to see posts tagged with that particular subject, or click on a word in the category cloud on the right side of the screen for more specific choices.

Atypical Top? (by Springheel Jack)

By -

(Preface from Tim: I mentioned in the comments section last night that if you were a bearish sort and inclined toward religion, that you should pray for a hearty rally. With the /ES up 11.50 as I am typing this, it looks like God was listening. It sounds crazy, but this is exactly what we want right now. I have many small short positions right now, but I am delighted at the push higher.)

I don't use Elliot Wave much in my own charting, but I have a couple of favorite elliot wavers who are both excellent, and they are Pug and Alphahorn. Both run subscription services with an unprotected post every so often that is always worth reading. I mention this today because Pug switched his primary scenario yesterday to a count where we are in an atypical wave 4 after the wave up from July finished in February and Alpha is also considering that count.

That count would have SPX making a wave 3 top from July last year in February, then wave A down to the March low, Wave B to the high at the end of April, then we would now be in Wave C with a target in the 1250 area sometime in June or July. There are a couple of things that I'm seeing that lend some weight to this scenario.

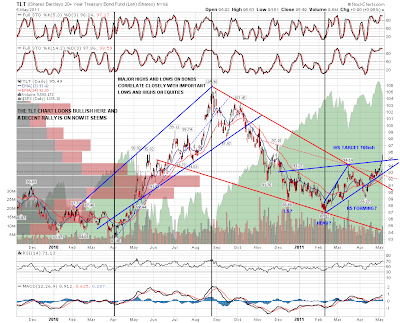
The first is the situation on bonds which generally inversely correlate closely with equities on major bottoms and tops. It's increasingly obvious that bonds made a major low in February, and I've been struggling to fit that in with what's happening on equities. Here's TLT on the daily chart where it has clearly bottomed and broken up. There is an IHS on the chart with three possible necklines and I'm taking the target as being in the 100 area:

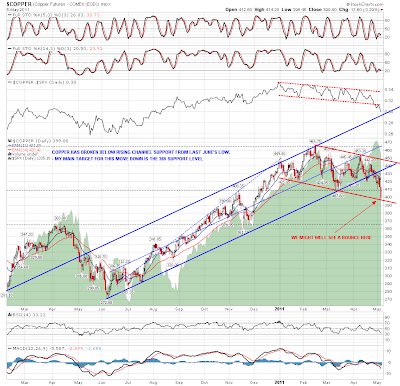
The other correlated market that has broken down is copper of course, which made a major high in February. That would also fit with a technical wave high on equities then. Here's the copper daily chart. My target on copper (larger timeframe) is 365 but you can see from the chart that it could well bounce here:

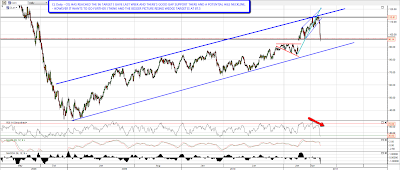
Do I buy Pug's count? It's very possible, though it isn't welcome news, as I was expecting a larger summer bear move from a higher level. Where we are now potential downside looks limited unless the bull market is over, which seems rather doubtful to me. Pug has a target in the 1250 area, and in my view this wave 4 could not go lower than about 1220, as that would break the main lower trendline for the bull market rising channel, which I'm not expecting to see broken until this bull market has made a final top. Here that is on the weekly chart, where you can also see that the most recent high came with sharp negative divergence on the weekly RSI:

Looking just at the rising channel from the July low last year, support there is in the 1300 area. There's been negative divergence on the daily chart since November last year and it's worth noting that the last SPX high hit the declining trendline on RSI exactly:

A large part of the immediate bull case was the IHS on SPX of course, and the neckline on that was thoroughly trashed yesterday. That doesn't mean that it can't play out of course, but it makes it much less likely:

Overall I think Pug's count is convincing, and I'm going to be assuming that is the case until demonstrated otherwise by a major support or resistance break on SPX. In that context the likelihood would be that we have seen a major interim top on commodities, but not a final high, and I'll be watching the key 365 level on copper to see whether it holds. The equivalent level on oil would be in the 86 area, and now that we have reached the 96 area that I called for last week at the oil double-top, I'm expecting a bounce, and then a move to test main support at 86:

My main target for this move down on ES is in the 1318-20 area today, but declining resistance has been very thoroughly tested overnight, and I'm wondering whether we see a bounce here that would probably coincide with the copper bounce that I was suggesting in the copper chart above. Declining resistance is now at 1339 and a move with any conviction above 1340 should deliver a strong bounce today. As I've been writing this the employment figures have come out and resistance is now broken so I'm assuming a bounce for today that may last into Monday.

Now What? (by Leaf_West)

By -

Small caps are market leaders in the bigger trends typically, so if we want to assess where we are and where we are going, let's take a look at the Russell 2000 ETF (IWM).

IWM_May5, 2011_60min

Shorter term view is that we bounced right off of some important GANN support levels on the 60min chart.  The stochastic indicator looks like it could allow a continuation in the bounce.  eSignal has a trend confirmation feature in their GET software … the trading rules are to short this confirmed downtrend when the stochastic indicator breaks above the 75 level and you get signal/trigger candles.


IWM_May5, 2011_Daily

The daily chart believe it or not is still in a confirmed uptrend … 20EMA is above the 50EMA and price bounced exactly of the 50EMA this morning at $82.42.  The Ascending Triangle for the IWM actually fits more perfectly than the one I was using on the SPY last week.  If you study Ascending Triangles the "E" leg down is very scary and people get cold feet and the weak hands bail as they see a "failure" at busting higher at the end of "D".

Prepared traders actually step in at the 'E" intersection and buy.  The theory is that if the pattern fails a tight stop will keep you out of real trouble and if it works out, those weaker hands will come back to the market and help boost your profits in the days to come.

If the Pattern is going to fail it will be with a "truncated" move off of the "E" intersection.  Typically that truncation will happen before price gets 50% of the way back to the other/upper trendline … that level in this case is $84.615.

The trigger point for conservative traders is the close under today's low which at this writing is that $82.42 50EMA level.

Cheers … Leaf_West

Hedging Update (by Dave Pinsen)

By -

In the table below, I've updated the costs (as of Wednesday's close) of hedging the Dow-, NASDAQ 100-, and S&P 500-tracking ETFs against greater-than-20% declines over the next several months, using the optimal puts, along with the costs of similarly hedging a handful of their most widely-traded components. As with the last hedging update post, I included five precious metals ETFs to the table as well. First, though, a quick update on a couple of speculative options bets, and a reminder of why I'm using ITM puts for directional bets and optimal puts for hedging purposes.

Two more speculative options bets

On Wednesday, I got a fill on ITM October calls on Superior Industries (SUP) and ITM December calls on ASM International, NV (ASMI) (I had entered limit orders for several bullish and bearish bets, but those two calls are the ones that I got filled on). Same M.O. with these as I described with COHR earlier this week: using the guidelines Tim mentioned in his book Chart Your Way To Profits, plus the additional guideline of buying options at a ~20%+ discount to model estimates of their fair market value. I mentioned both options buys on Short Screen during the day Wednesday.

Hedging versus betting

To find the optimal puts for hedging, I enter the symbol of the stock or ETF I'm looking to hedge in the “symbol” field of Portfolio Armor (available on the web and as an Apple iOS app), enter the number of shares in the “shares owned” field, and then enter the maximum decline I'm willing to risk in the “threshold” field. Then Portfolio Armor uses its algorithm to scan for the optimal puts to provide that level of protection at the lowest cost.

On rare occasions (I’ve seen it happen once, so far) the optimal puts Portfolio Armor presents might be in-the-money; in most cases, however, they will be out-of-the-money. Since I was making directional bets in the cases above, though, and not hedging, I bought slightly in-the-money options. That makes sense for directional bets (when you are willing to pay more to reduce the odds against your bet) but would be sub-optimal in most cases for hedging (when you want to get a certain level of protection at the lowest possible cost).

Chosing a threshold

When using Portfolio Armor, you can enter any percentage you want in the threshold field (though the larger the percentage you enter, the more likely there will be optimal puts available for that level of protection). As I've mentioned before, the threshold I usually use when I hedge is 20% (i.e., I want protection against any decline worse than that). The idea for a 20% threshold came from a comment fund manager (and Stanford finance Ph.D.) John Hussman made in October 2008:

An intolerable loss, in my view, is one that requires a heroic recovery simply to break even… a short-term loss of 20%, particularly after the market has become severely depressed, should not be at all intolerable to long-term investors because such losses are generally reversed in the first few months of an advance (or even a powerful bear market

Essentially, 20% is a large enough threshold that it reduces the cost of hedging but not so large that it precludes a recovery. So 20% is the threshold I've used in the table below.

Times to expiration

In his research, the finance academic who developed Portfolio Armor's algorithm found that options with approximately six months to expiration (which today would be the ones expiring in November) tend to offer the best combination of liquidity and cost, so those are the put options for which Portfolio Armor's algorithm aims. When puts with about six months to expiration are not available, Portfolio Armor searches for slightly longer or shorter times to expiration.

A difference in the table this time

Note that, unlike in the table last time, when the hedging costs of the index ETFs QQQ, SPY, and DIA were based on optimal puts expiring in October, this time they are based on optimal puts expiring in December (December 29th, to be exact, in the case of DIA and QQQ, so that's almost 8 months of insurance from today). All things equal, options with expirations further out generally cost more.


Symbol

Name

Cost of Protection (as % of Position value)

Widely-Traded Stocks

INTC

Intel

1.62%*

CSCO

Cisco Systems

1.60%*

MSFT

Microsoft

1.42%*

ORCL

Oracle

3.18%***

BAC

Bank of America

2.40%**

F

Ford

4.16%***

GE

GE

3.16%***

PFE

Pfizer

2.23%***

WFC

Wells Fargo

3.23%*

T

AT&T

1.35%*

AA

Alcoa

2.40%*

Major Index ETFs

QQQ

PowerShares QQQ Trust

1.77%***

SPY

SPDR S&P 500

1.56%***

DIA

SPDR Dow Jones Industrial Average

1.41%***

Precious Metals ETFs

GLD

SPDR Gold Trust

0.85%***

SLV

iShares Silver Trust

4.60%*

DBP

PowerShares DB Precious Metals

1.66%*

SGOL

ETFS Physical Swiss Gold Shares

2.99%***

SIVR

ETFS Physical Silver Shares

2.56%***

*Based on optimal puts expiring in October, 2011

**Based on optimal puts expiring in November, 2011

***Based on optimal puts expiring in December, 2011

Disclosure: I'm holding some puts on DIA, and some calls on SUP, ASMI, and COHR.

Aero Goes Postal

By -

My best-performing short today was Aeropostale (ARO), which I've been building a position in for a little while now. It's down over 15% today, and although I've covered the position for the moment, I'd be very interested in re-shorting this on any bounceback. I think that, over the long term, it's going to head closer and closer to $zero.

0505-aro

SPECIAL NOTE – Sometimes I complain that there's not much in the hopper. This is currently not the case. There are probably ten posts waiting in the wings, and more to come. They are going to get increasingly stale, but unfortunately, I'm quite busy this afternoon, so you could be stuck with this post for a bit. When I do manage to issue new posts, I probably won't be able to say NEW POST, so you'll have to rely on your wits (and other Slopers) to figure it out. Be strong.