Slope of Hope Blog Posts
Slope initially began as a blog, so this is where most of the website’s content resides. Here we have tens of thousands of posts dating back over a decade. These are listed in reverse chronological order. Click on any category icon below to see posts tagged with that particular subject, or click on a word in the category cloud on the right side of the screen for more specific choices.
Absolutely Nothing Holding Up GGB Anymore
Unfinished Downside (by Springheel Jack)
I started looking at the charts this morning assuming that we'd see a bounce on equities. That might happen, but the cast of the charts is pretty bearish looking so we'll see. I've been redoing my 60min charts on ES and NQ and the overall situation looks pretty clear on both. First is ES where there's an almost perfect rising channel from the March lows and I've also marked in the big IHS in case we see a neckline retest today:
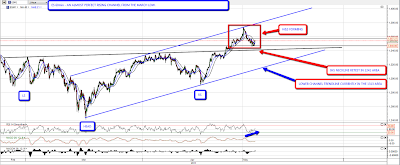
The key levels on the main ES rising channel chart are the neckline retest in the 1241 area, and the lower channel trendline in the 1313 area. There's also a little H&S forming on that chart that I've blown up below to have a closer look at and the target for that pattern would be in the 1320 area:

On NQ the rise from the March lows has taken the form of a broadening ascending wedge and I've added in the downsloping neckline IHS on NQ as well. The key retracement targets on NQ are the IHS neckline retest in the 2335 area, and wedge support in the 2280 area:
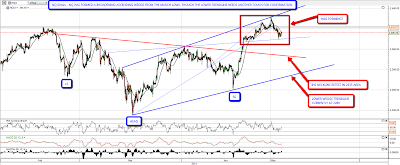
There's also a little H&S forming on the NQ chart. It isn't as easy on the eye as the ES equivalent but it's well worth noting. These two patterns give the short term charts their rather bearish look this morning:
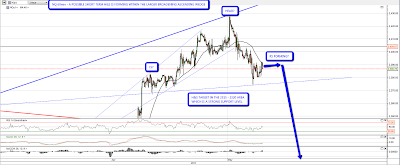
Obviously we're seeing a broad-based pullback in commodities at the moment, and I posted the oil chart a couple of times last week to highlight the possible double top that might be forming there. Oil then made a higher high slightly over 113.5 resistance and has since retraced to short term rising support in the 110 area. It might bounce here, but if it breaks down I'm looking for a retest of support in the 96 area:

The case for a USD low is building in this area. Everyone has more or less written it off, which is bullish, and several currencies are now falling against it. What's holding it down is EURUSD strength, so I've had a look at that this morning to see if I can detect any signs of weakness. Looking at the daily chart though I'm not seeing any reason for EURUSD to reverse here, unless it is for a short term retest of broken resistance in the 1.4625 area. The obvious reversal area for EURUSD is in the 1.506 to 1.518 area. It may not make it of course, but I'd be reluctant to short it before it either makes it there or breaks support convincingly:

There's a very strong argument that treasuries have already made an important low in January, and they have risen to test a very important resistance level both in recent months and in the May 2009 to May 2010 period. If they break 124 and hold it then the treasuries rally is on, strange as it seems that anyone would wish to buy these. History suggests that it would be best to wait until resistance is broken before playing this as this could be the top of a trading range that might last a few months longer:

I'm leaning short today on the basis of the H&S patterns on ES and NQ. These are both strengthened by the larger setups on ES and NQ, though any bearish setup has obviously been higher risk for the last few months
Long IFSIA, Short USG
Below is a market neutral trade I opened Tuesday morning, but first I wanted to thank those of you who have downloaded and rated the Portfolio Armor iOS app. When I checked AppShopper.com at the end of last week, I saw the screen cap below, which showed that, among the top 200 paid finance iOS apps, Portfolio Armor had the highest customer rating. Thanks again for that.

Also, quick follow up on my last post ("Speculative Options Buy Update"): In that post, I mentioned that COHR would be releasing its Q after the close Tuesday. It reported EPS and revenues that beat estimates( EPS of $0.83 vs. estimate of $0.78; revenues of $200.9M vs. estimate of $192.68M), so we got a little lucky there. The underlying is up about 3% afterhours as I type this, reversing today's decline, but we'll see how this pans out going forward. On to Tuesday's market neutral pair.
On Tuesday morning, I shorted USG at $15.09 and bought an equivalent dollar amount of IFSIA at $18.55. I e-mailed the trade idea to those on the market neutral trade notification list before market hours Tuesday.
USG Corporation (NYSE: USG) manufactures Sheetrock and other times of wallboard. I shorted this one last year, and got stopped out for a single-digit loss. I plan on using a double-digit trailing stop this time, on both the long and short side of this trade. I’ll probably use slightly tighter stops initially this time than I did initially on the last market neutral trade (long IMO, short TRGL) though. Charts below courtesy of Finviz.com.
Short Screen shows an Altman Z-Score of 0.59 for USG. Scores below 1.81 are considered an indication of financial distress, according to the model.
USG is currently rated as having Average Accounting & Governance Risk (AGR®), receiving an AGR Score of 70 percentile among the approximately 8,000 companies in North America rated by Audit Integrity, indicating higher accounting and governance risk than 30% of the other companies.
USG had negative earnings over the trailing twelve months and has an PEG ratio of -0.19 (based on analysts’ estimates of its earnings over the next five years).
Interface, Inc. (NASDAQ: IFSIA) manufactures modular and broadloom carpets, and other floor covering products.
IFSIA has an Altman Z-Score of 3.37. Scores above 3 are considered indications of financial strength.
IFSIA is currently rated as having Conservative Accounting & Governance Risk (AGR®), receiving an AGR Score of 98 percentile among the approximately 8,000 companies in North America rated by Audit Integrity, indicating higher accounting and governance risk than 2% of the other companies.
IFSIA looks pricey based on trailing earnings, but it has a PEG ratio of 1.44 (based on analysts’ estimates of its earnings over the next five years), which looks a little more reasonable.
Goldman Sachs (GS) … (by Leaf_West)
I was hawking GS near the end of the day yesterday and had a plan in place based on how it opened this morning … I tweeted about opening a position at $151.30 and the plan to take a scalp profit at the next GANN target at $152.70.
I like the GS potential up to that resistance line around $154.80 and then we will have to see what everything looks like.
Cheers … Leaf_West
