
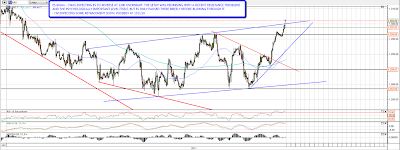
I'm slightly shaken by the strength of this move up. I had a very nice setup for a reversal at 1300 ES which broke overnight and I wasn't expecting that:
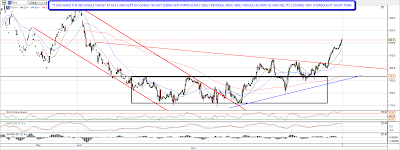
I have another nice setup for NQ to make a short term high just under 2300 and I'm now wondering if that will hold:

TF made my 814.1 rectangle target and kept on going. I don't have any particularly obvious reversal levels I'm looking at there though like the other two it is looking very overbought on the 60min charts:
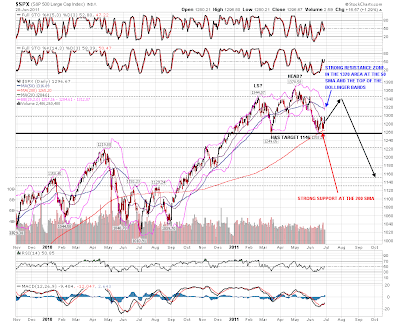
If SPX can hold 1300 today then the next obvious target on the daily chart is the daily 50 SMA at 1316.89, which is in the same area as the top of the bollinger band. Not that far away now:
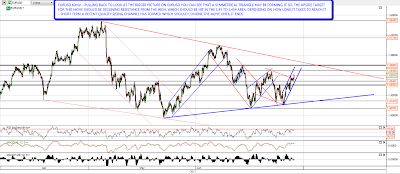
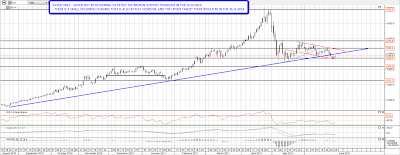
In terms of USD, my target for the broken rising wedge is at 74.84, and DX is at 75.15 now. I'm thinking it may overshoot somewhat, as one EURUSD gets over the lat big high at 1.4445, then the obvious target in my view would be declining resistance in the 1.45 to 1.454 area, depending on the time taken to reach that target. That is a natural reversal level for what may well be a large symmetrical triangle. I'm also considering 1.45 as a possible IHS neckline. Regardless of the target EURUSD has formed a rising channel from the last low and I'd expect a hit of the lower channel trendline before the upside target is hit:
Silver has been recovering somewhat in the last day and I'm wondering about a retest of broken support in the 35.2 area. I do still have a smaller declining channel in play though, so we could see a move to the 36.25 to touch the upper trendline there:
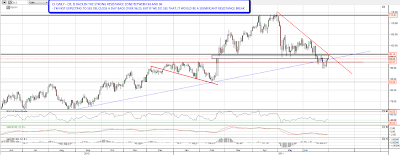
Oil has recovered into the strong 94-96 resistance area. I'm not expecting to see a daily close over 96.25, but if we do see that it would look bullish. Neither technicals nor geopolitics favor a big move up on oil here though, so I'd be surprised to see that:
Overall I'm looking for some retracement soon, not least because without retracements I don't get a lot to work with in terms of trendlines. Equities are looking very oversold and at the time of writing my resistance level on NQ is holding so that might well be here. If not I'm seeing a lot of resistance in the 1311 ES area, which is also the area for the daily 50 SMA on SPX and the top of the daily SPX bollinger band.
