
Another interesting overnight session but I'll post charts for SPX, NDX and RUT today as well as the charts for other important markets. The overnight session is looking sharply higher at the moment and for a number of reasons I'm wondering about a strong move up. I'll explain more about that later on but here's the SPX 30min chart for the moment, showing the rough broken triangle there. There's some positive divergence on the 30min RSI (often a good indicator) and the obvious retracement target would be a retest of broken support in the 1170 area:

On NDX, the rising wedge that broke down last week looks very ominous, but again we have some positive RSI divergence and if NDX can recover the broken support trendline then the first target is the gap fill at 2258.30. Any move above there would be a significant resistance break and support the possibility that this rising wedge has evolved into a rising channel, with the next target then at rising wedge / channel resistance:

On RUT there's also some positive divergence on the 30min RSI and the obvious target is the gap fill at 664.58. A break above 670 would be a significant break back up through broken triangle support:

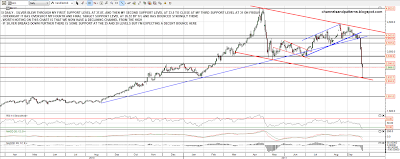
Equities aren't the reason I'm wondering about a big bounce here though so much as the big support levels hit on many other markets on Friday or overnight. Silver, after an astounding drop in the last three days, has hit the fourth and last support level that I highlighted last week when SI was still in the 40 area. Support at 26.32 was overshot overnight by 17c and SI has bounced back now to over $29. This is a potentially very significant low for silver and there is now also a large declining channel established on silver that I've shown on the chart:
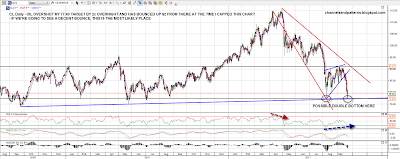
Oil futures also hit my 77.40 target overnight, overshooting by only 2c and has since bounced back up $3 at the time of writing. Again, this is a very significant support level on CL / Oil, and we may well see a strong bounce here:
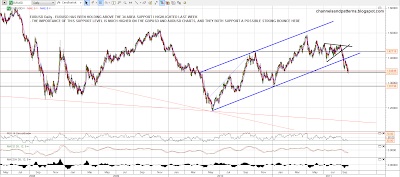
I mentioned the 1.34 area support for EURUSD last week and that has held for a couple of days now. It isn't as obvious from the chart but this is a very big support level for other USD currency pairs as well. I posted the GBPUSD chart on Friday to show that and a glance at the AUDUSD daily chart will show the same. Who can know what will happen in Europe this week but from a technical perspective, this is a natural level for big bounce on EUR and other currencies against USD:
Copper hasn't reached an obvious bounce level here yet, but I'm wondering about 30yr Treasury futures (ZB). There are obvious signs of a possible ST high on the 60min chart with negative RSI divergence and a break down through short term support. If we see a decent retracement then the two month support trendline is in the 140'22 area at the moment:

Looking at the ZB daily chart I'm wondering about a possible major top here with marked negative divergence and a double resistance trendline hit last week:

None of this means that I'm thinking we've seen the low on equities here. As I showed last week I'd expect to see lows made on EEM and copper made before equities, with bonds and precious metals possibly doing the same. It seems unlikely that we've seen a major high on USD, but we might have seen a high that could last a few weeks. We may also be seeing some significant lows now on some beaten down stocks that may hold on the next move down. We'll see. The Gap Guy suggests caution on a gap up today.
