
I'm going to concentrate mainly on equities today, with quick looks also at gold, treasuries and AUDUSD. On the SPX 30min yesterday's close wasn't yet at broken support in the 1170 area, though with ES now at 1174.5 as I write, we may well gap over that at the open. Worth noting is that no bounce since the August low has ended without hitting the RSI 70 line on the 30min chart:

The daily close today will also be significant. On my SPX daily support/resistance levels chart daily resistance is in the 1178 area. A daily close above this level would strongly suggest a test of the 1204 resistance level:

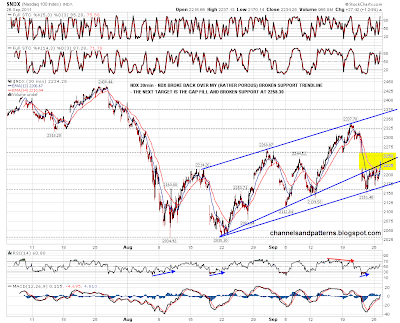
On the NDX 30min chart my rather porous broken support trendline in the 2230 area was breached at the close. The next target is the gap fill and broken support at 2258.30:
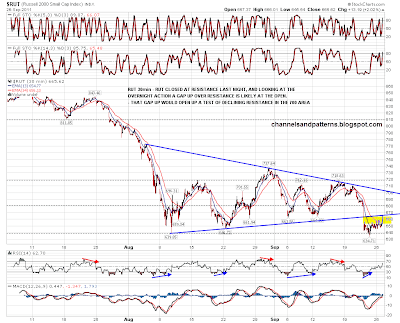
On the RUT 30min chart RUT close at the broken triangle support trendline that I highlighted yesterday. A gap up over it at the open currently looks likely and that would open up a test of declining resistance in the 702 area
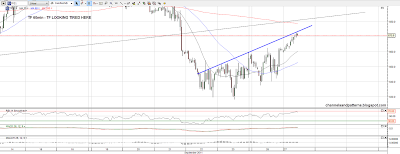
Short term though TF (RUT futures) are looking a little tired and failing so far to breach a rising resistance trendline I have there on the 60min:
I mentioned yesterday that GBPUSD and AUDUSD particularly have bounced at levels which suggest that we could see a bounce lasting several weeks. I posted the GBPUSD chart on Friday so here is the AUDUSD daily chart, which is definitely thought-provoking:

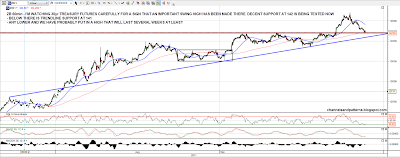
I'm watching 30yr treasury futures (ZB) carefully here to see whether short term support holds. If it doesn't then it's very possible that we've seen a major swing high on treasuries, and possibly even a major top. My ZB daily chart that I posted yesterday shows the trendline hit that could indicate a major high on treasuries. My ZB 60min chart below shows support at 142, being tested now, and rising support below in the 141 area. A break below would support an extended rally here on equities:
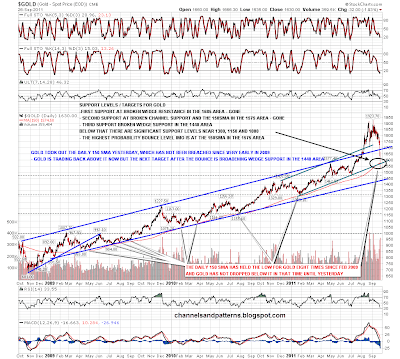
I don't think the gold chart is of great inter-market significance, but the break below support in the 1575 area yesterday, though not sustained long, strongly suggests to me that we will soon see a break below there to rising support in the 1440 area. This break below 1575 was the first breach of the daily 150 SMA since early 2009:
I don't believe that a very major low is in on equities, as there aren't any of the usual bottoming signals. However we could be looking at a big rally that might reach the 1250 area on SPX and last several weeks. That's by no means certain yet, but I'll be watching treasuries and the daily resistance levels on SPX particularly for signs that a significant interim low is in. We're likely to see a big gap up at the open today, but it could well fill as everything is looking rather overbought short term.
