
Well after all the anticipation, the Fed announcement yesterday amounted to little or nothing presented as action. Sure the Fed will roll over maturing treasuries and mortgage bonds but so what? With the Fed Twist program selling $1 of short term treasuries for every $1 of longer term treasuries purchased there will be no new money and in effect this is akin to supporting the housing market by not selling houses. The truth is that the annual market boosting QE pushes of the last two years have now been abandoned. That's a good thing as the markets can now find their natural levels without the effective Fed subsidies for equities that we saw in 2009 and 2010.
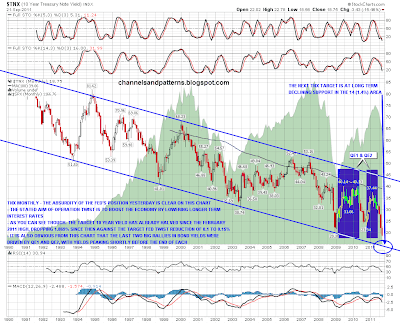
As for the apparent aim of Twist to reduce 10 year treasury yields by 0.1% to 0.15%, it is laughable. For starters 10 year treasury yields have halved since the February 2011 high from 3.744% to 1.875% at the close yesterday, so the target reduction is less than 10% of the reduction we have already seen this year. Why have rates fallen so much since February? Because QE2 was drawing to a close with no announcement of a QE3 that has now been ruled out for the time being by the Fed. Both of the big rallies in treasury yields that we have seen since 2009 were clearly driven mainly by QE1 and QE2 and died with them, as you can see from the chart below. This is a 20 year TNX (10 year treasury yields) chart and you can see that the obvious target now is in the 14 (1.4%) area:
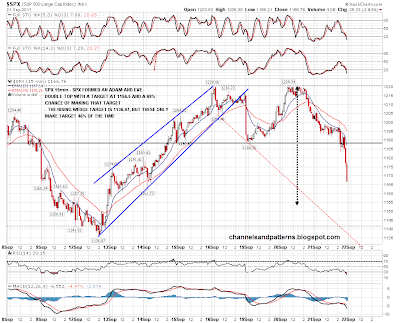
I'm going to do a broad spectrum post today looking across the main markets as I think we are starting another big move down on equities now, and I'd like to review the various interrelated market areas. I'll have a quick look at SPX though to identify the main levels that are important today. On the SPX 15min chart the double-top target is at 1156.05, which is likely to be made with ES trading under 1130 as I write this. The rising wedge target is at the last swing low at 1136.07 and that is a very important level today. If the next swing low is above 1136.07 then we might see another last push up before the next big move down begins. If 1136.07 breaks however then the chances are that big move down has already started. as usual I have taken my pattern targets and probabilities from Bulkowski's outstanding reference site here and the probabilities are marked on the chart:
On the SPX daily chart I've marked in the two key target levels for today. The first is rising support from the SPX low and the bottom daily bollinger band in the 1145-7 area, and the second is 1136.07 again:

Looking at the Vix I gave a bold target over 36 yesterday morning and it reached 37.32, closing at the high. As you can see from the chart this was somewhat more than a retest and if sustained today my next target is in the 38.5 area. Anything over 40 will suggest that new highs will be coming soon:

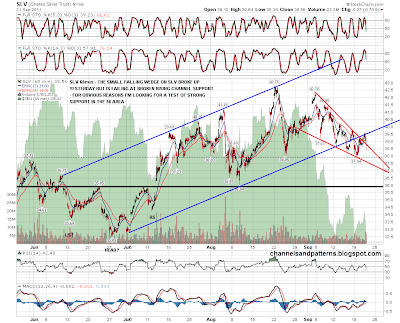
On precious metals the picture was complex yesterday morning with two competing scenarios. The first was a rising channel from the lows that I have posted often and posted last when it broke last week, but a smaller falling wedge had formed from the last high and that broke up yesterday morning. So far SLV has failed at broken rising channel support and unless that is retested and broken quickly then the broken channel is the pattern to watch. I'm looking for a test of strong support (and potential H&S neckline) in the 36 area, and if that is broken, then a test of the June lows:
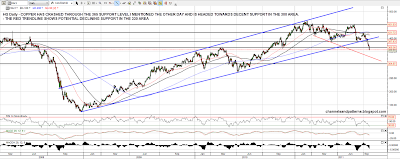
Bonds broke up on the Fed announcement yesterday, which as much as anything else triggered the waterfall decline in equities that we saw after the Fed announcement. EEM made a new low and copper has broken the important support level at 365 that I highlighted on Tuesday morning. I'm looking for a move on copper futures at least to declining support in the 330 area and possibly further to test support in the 300 area. As I mentioned yesterday, I'm expecting to see major lows on copper and EEM significantly before any major low on equities:
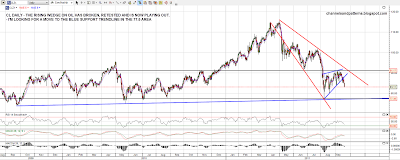
As I mentioned on Tuesday morning the rising wedge on oil broke down last week and has since retested this week and fallen hard yesterday. I have a strong support level and rising support in the 77.4 to 77.6 area and that's my main target area for this move down. The rising support trendline is a decent one so it may hold. a break below it would look very bearish and suggest a move into the 60s:
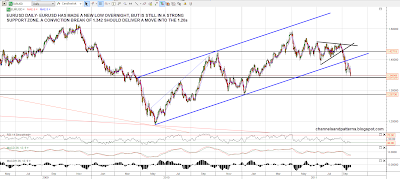
EURUSD is at an interesting level here but is still in a strong support zone between 1.342 and 1.35. A conviction break below 1.342 should deliver a move to the 1.20s, but until then this is still a strong potential bounce area:
The ES 60min RSI is now extremely oversold and we may well see a low made and a strong bounce start this morning. I hoping for a retest of the ES lows later on with positive RSI divergence for a long signal. How far might that bounce go? Topside would probably be broken support in the 1182 area, but it might fail before then.
