
As a chartist I try to read what my charts are telling me without much preconception of what I am expecting to happen. That's important as it's easy to just see what you want to see on a chart, while disregarding anything that doesn't fit with your view. That's one reason I check Pug's EW counts every day, as he's not only an excellent chartist, but he also reaches conclusions using methodology very different from my own, and while I struggle to ignore my bearish bias, Pug struggles to ignore his bullish bias. It's a good cross-check to help me keep an open mind.
Now Pug's main count at the moment is suggesting that we have made an important swing low, and his upside target for SPX for what would most likely be a multi-month rally is in the 1250 to 1300 area. That's a high target, and would not only take us past potentially strong resistance at the SPX monthly 20 SMA at 1208, but also potentially through even stronger resistance in the 1250-60 area.
Is there a scenario developing that I can see to support this very bullish scenario? Well as it happens there is, and we may well be seeing that bullish reversal setup develop at the moment. It's been rare in recent years to see a major reversal up on SPX without an decent quality IHS reversal pattern supporting it, and I've been watching to see whether one develops. The most likely area to see that develop has now been reached on multiple indices and what happens here is very important as a result.
On the SPX chart my 30min RSI indicator is at last showing a bit of negative divergence. That suggsts that this very long wave up may well be topping out near the last swing high. That swing high is also the neckline on a potential IHS pattern that may be forming and I've shown that with the target in the 1315 area on the chart:

Now you might well be thinking that at this early stage where the head hasn't even finished forming, a potential IHS isn't worth much consideration. If so then I would suggest that you have a look at the first chart I posted in my post on 23rd July last year, sketching out a potential IHS at an even earlier stage, that then developed and played out. You can see that here. It is at the very least food for thought.
The ES, NQ and TF charts are all at similar stages, having reached overbought levels on the 60min RSI, and having formed rough rising wedges, now showing weakness at or below the potential IHS necklines. Here's the setup on the ES 60min chart:

Here's the setup on the NQ 60min chart:

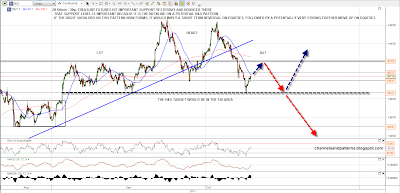
Here's the setup on the TF 60min chart:

I've marked an alternate path on each IHS in case of failure at the neckline once the IHS has formed. It's always worth remembering that a lot of H&S patterns fail at the neckline or near the ideal top of the right shoulder. Is there any support from other markets for this scenario on equities? Well as it happens there is. Both 30yr treasury futures (ZB) and EURUSD reversed at potential necklines yesterday and may be forming reversal patterns there. Here's that possible setup on the ZB 60min chart:
Here's that possible setup on the EURUSD 60min chart:

Given the economic backdrop, what could happen to deliver this big multi-month reversal? Well policymakers in the developed world might paper over the Euro area problems sufficiently well to kick the crisis a few more months down the road, and it might be that the earnings season that started yesterday might surprise to the upside. This reversal scenario would only need two or three months to play out and there are much larger potential patterns developing here that point strongly downwards after a strong rally here.
One of those is on EEM and I posted this two or three weeks ago highlighting the strong support and potential H&S neckline in the 33.5 to 34.5 area. We have seen a strong bounce there and the right shoulder on a very large H&S pattern may now be developing there, with a pattern target near the 2008 lows:

There's a similar pattern developing on GBPUSD that points to long term strong support in the 1.39 to 1.40 area. Again I've posted this before and highlighted 1.534 as a potentially very strong support area:

Obviously all these charts are very speculative at the moment and may well be overtaken by events in this very news-driven market. Still I try always to consider multiple scenarios and find that considering alternate scenarios helps to avoid standing in front of trains headed in the opposite direction to the one I was expecting.
Short term, as I mentioned, there is a strong chance of reversal in the short term on equities, and if we reverse here, then we should all watch for the potential right shoulders on these currently speculative patterns to develop. If they do develop then bears should be correspondingly cautious.
