
Obviously we saw a huge gap and run up yesterday on the news that central banks are intervening to save the world …… again …… for a while. How long might this last? Who can say? We'll see how it goes but this might have a shot of lasting into mid-January I think, and might even run further. Are we seeing the start of a major new bull market in equities? I really doubt that but you never know I guess.
On SPY my IHS target was obviously made yesterday in that single spike up. I'm doubtful that was a high yesterday and I have my eye on the next open gap above in the 128.6 area:
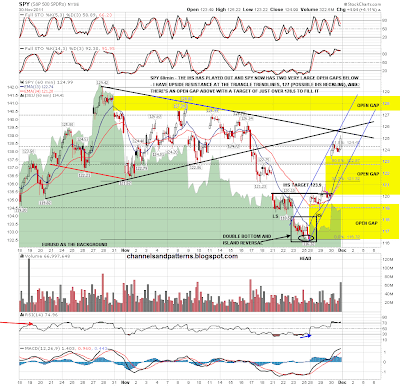
In the short term the 60min RSI on ES is looking oversold with negative divergence. We also hit two resistance trendlines at the high yesterday so I'm thinking we may well see some retracement today. If so I am watching for a hit of rising support from the last low, which is also the lower trendline on a candidate rising channel from that low. If we see that hit, that would be a nice long entry level with a stop not far below:

On the bigger picture bonds and USD are very important for any rally on equities here. The picture looks distinctly bullish on EURUSD with the falling wedge having now clearly broken up, and with immediate support established at 1.343. Short term the next upside target is the potential IHS neckline at 1.361:

I've been considering the longer term picture on 30yr Treasury futures (ZB) here, and support for the current uptrend (and broadening ascending wedge) is in the 138.5 to 139 area. The bears would like to see that hold. If it breaks, then the neckline for the candidate double-top on ZB is at 135 and that would be the next really important support level. If 135 was broken then the double-top pattern target would be at 123, but realistically I'd be looking for a hit of the four year support trendline that is currently just above 120. A move of that size on treasuries would look very bullish for equities as long as the inverse correlation between bonds and equities holds:

Oil has rallied back over 100 in recent days, and the short term double-bottom there in the 95 area has played out to target. Retracement very soon is looking likely however, with a decent rising wedge that has formed from 95, and negative RSI divergence at the last high:

Lastly gold futures, where the money that you can't print more of got a big boost yesterday that has carried it back to 1750 resistance. I have declining resistance from the high in the 1765-70 area, and major resistance at 1800. A daily close above 1800 would suggest a test of the summer highs:

