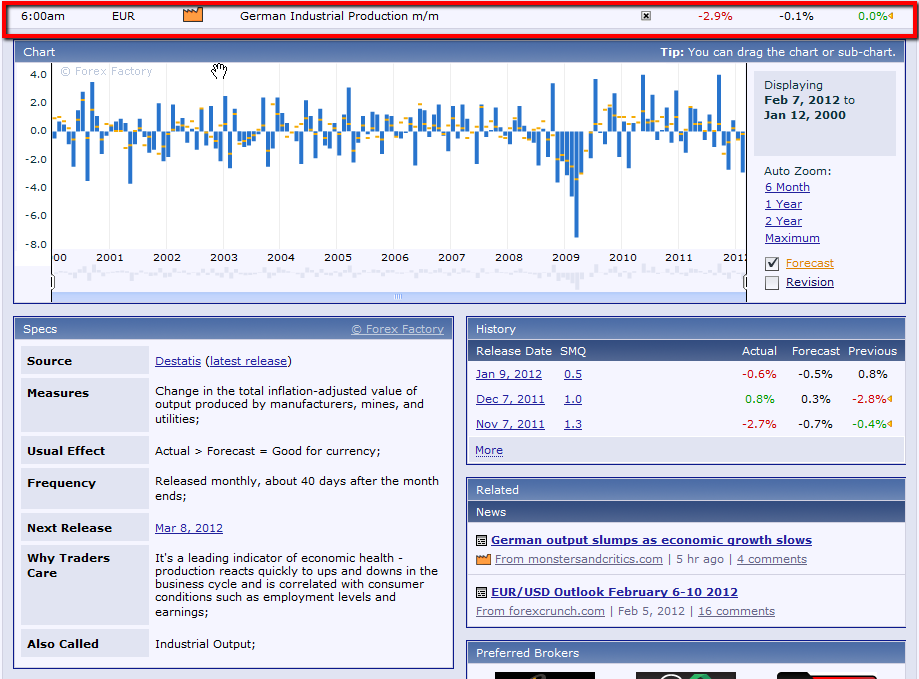
Data released today shows a sharp drop in German Industrial Production well into, once again, 2009 levels, as shown on the graph below. Production has been in a general downtrend since its peak in 2010.
Slope initially began as a blog, so this is where most of the website’s content resides. Here we have tens of thousands of posts dating back over a decade. These are listed in reverse chronological order. Click on any category icon below to see posts tagged with that particular subject, or click on a word in the category cloud on the right side of the screen for more specific choices.
Well, this morning was the final straw for me. Everything was looking ship-shape for a nice tumble today, and then ol' Ben came out and said whatever he needed to say to crash the dollar and goose equities again. The GDX, shown below on a minute bar chart, nicely expresses how a very clean breakdown was turned around 180 degrees.
I have gone long sixteen carefully-chosen equities. I am still keeping a big chunk of my portfolio in cash (a little over 50% right now), and I've got a 30/70 split between long/short. So, effectively, I'm only 20% short the market.
In any case, I cannot depend on the market going down in order to turn any sort of profit, so I've got a hybrid portfolio again. The cleanness of the NASDAQ breakout is simply too evident in order to not have a single long position.
My entry price=67.15; my stop price=69.61; my target=low 50s.
The longer term trendlines from October and November are looking a little thin here, as I've mentioned before, but in the shorter term there is no shortage whatever of decent trendlines, and looking at those this morning I think everyone is likely to get a surprise, as there seems to be a powerful consensus that we are going to see new highs today, and my charts are suggesting a move down instead. You be the judge, but I'll show you what I'm looking at.
Short term the move up since last week's low on ES has formed a very nice looking rising wedge cum channel, which I posted yesterday. I suggested yesterday morning that this looked likely to retest the high in the 1342 area before hitting the support trendline and I was very pleased to see that play out exactly as I predicted, albeit in slow motion. The next upside target is in the 1353.50 area at the moment, but I have marked in the potential double-top that is now in play if rising support breaks here:
