
That was a nice move up to a new high on SPX yesterday, but it isn't yet a clear break out of the whippy sideways to up action of recent weeks. It's possible that we'll see a continuation of this sort of action into the 1442 SPX pivot and then an interim top there. The 2010 and 2011 tops were at major technical resistance areas and the interim top in 2012 may well be the same. The next one up is the 1442 SPX pivot and we'll see there whether this move up has the juice left to break over that to the next pivot north of 1500.
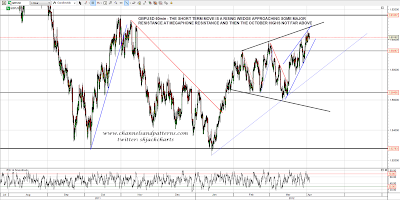
Short term I called the high (on twitter) yesterday on ES nicely with a short term broadening ascending wedge. I have two possible support trendlines for that wedge and the higher one has been hit overnight. The lower one is in the 1406 area if that breaks. Worth mentioning here is that these patterns are 73% bearish and a breakdown would target the 1386.5 area low on ES. The likely target would be a little higher as I'll be showing on the SPX chart. Declining resistance from yesterdays high is currently in the 1412.5 area and I would be leaning towards seeing a new high on a break of that trendline. Here's the ES 15min chart with the wedge:

If we do see a breakdown from that ES wedge then I'd be looking for a possible move to the 1395 SPX area at rising support from the Dec 19th low. You can see why I'm thinking this might happen from the SPX 60min chart below:

I mentioned yesterday that there was a very nice bullish setup with a move up on equities supported by a move up on EURUSD and a move down on bonds. That has since been coming apart, with ZB rallying very strongly and EURUSD breaking my rising channel. On ZB the weekend low has established another larger rising channel and if ZB can break over the last high at 139'05 a retest of broken 140 area support will be within easy reach. The 139-140 is strong resistance on ZB however and I wouldn't be at all surprised to see failure there:

On EURUSD my bullish IHS scenario is intact, but the rising channel break yesterday was a warning signal. The bulls need a conviction break above 1.3365 area resistance and the bears need a lower low below 1.325. Leaning cautiously bullish still:

USD currency pairs are coming up against some resistance here though. The current rally high at 1.3485 is obviously resistance on EURUSD, but GBPUSD is also nearing multiple points of strong resistance that could well signal a short term or larger low on USD. On GBPUSD, which has formed a rising wedge on the current move up, there is obviously that wedge resistance. Above there is megaphone resistance in the 1.608 area , and above that is resistance in the 1.616 area at the October high. My bigger picture on USD is bullish so we might well see the USD retracement bottom out soon:
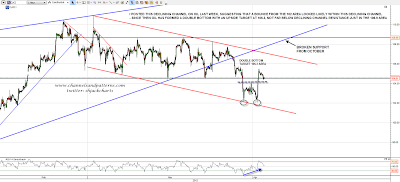
I posted a declining channel on oil last week after the break below rising support from October and suggested a likely low at 102 before a bounce into channel resistance. CL has since formed a double-bottom just above 102 and broken up. The target for that double-bottom is in the 106.3 area and channel resistance is in the 106.9 area:
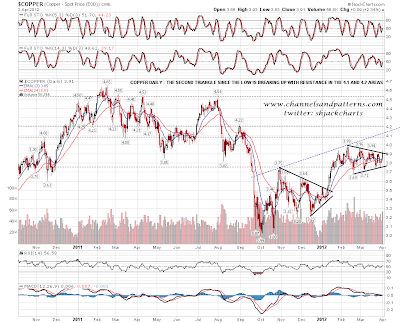
Copper has formed two triangles since the October low and is now breaking up from the second of those triangle. I'm seeing strong resistance in the 4.10 to 4.20 area:
I'm leaning bearish today until declining resistance on ES is broken, and I'm seeing a possible move to rising support from October on SPX in the 1395 area. I have some stats to finish with today, and the first stats are that April has been the best month on SPX since 1950, and the second best on SPX. The lean for this month is distinctly bullish and unless we see a definite bearish break I'm expecting to see at least a test of the 1442 SPX pivot in the next couple of weeks. Those stats are from Stock Trader's Almanac again.
The second set of stats are more bearish, and they are that if you had invested $10,000 in the Dow since 1950 between November and April, it would now be worth an impressive $801,587. The same $10,000 invested between May and October each year would now be worth a disappointing $9,605. The late part of this month kicks off topping season and summers are seasonally weak. This bull move has further to run in my view, but it may not be a lot further. That second stat is from Breakpoint Trades, who have an excellent subscription service that I use. They have a three week free trial if you're interested.
