
This first thing to mention today is that despite the title of this post I'm cautiously bullish for today and am still very much expecting the double-bottom target on SPX in the 1425-30 area to be made. That said, I'm seriously considering the possibility that we may see a second high of a double-top made there, or slightly higher close to the 1442 SPX pivot, before starting a decline into the usual summer low. The reason for the title is that I'm going to show some charts today that suggest that there may not be a usual summer low this year. Just a possibility of course, but worth bearing in mind as part of the bigger picture here.
Just as an aside I noticed that 'Bubbles' Greenspan was on the idiot box the other day arguing that equities are still cheap. I was reading an excellent book recently that I would recommend as essential reading for anyone trying to put the current period into historical context, and that book was Greenspan's Bubbles by Fleckenstein and Sheehan. In it is a detailed review of Greenspan's lifetime forecasting record, which was delightfully appalling with his strongly bullish forecasts at stock market highs, and strongly bearish forecasts at lows in the 1970s, and his strong reassurance that there were no real problems at the S&Ls shortly before the S&L crisis, but my favorite part was his being questioned by Senator Proxmire at his confirmation hearing in July 1987. During that hearing Proxmire noted that Greenspan's forecasting record when he served as the President of the Council of Economic Advisers was 'dismal', and that his predictions on future interest rates 'were wrong by the largest margin of those made during the period under review'. He noted optimistically that 'hopefully when you get to the Federal Reserve Board, everything will come up roses. You can't always be wrong.' Very funny in a tragic kind of way.
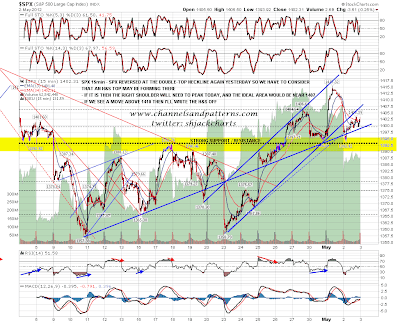
Anyway, to the charts. On the SPX 15min chart I noted yesterday that another test of support at 1394 would set up a possible H&S there. If that continues to form the right shoulder high would need to be put in today and the ideal target would be in the 1407 SPX area. Anything over 1410 and I would write it off and just be looking at the larger W or double-bottom target in the 1425-30 SPX area:
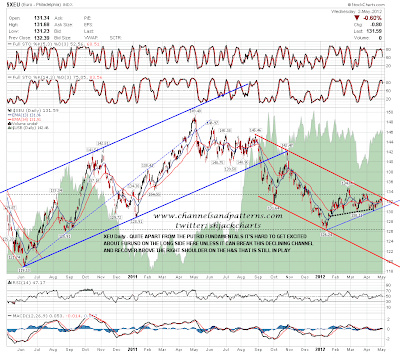
EURUSD has been struggling this week and I had a look at the trading hours only chart to see whether I could get a better read on EURUSD there. Sure enough there is a declining channel from last August still in play and EURUSD will need to break over that to make any more headway. A break below rising support from the January low would look bearish and it will need to break one way or the other soon. It's worth noting that the H&S that I was posting a few weeks ago is still in play and that a move to the lower trendline of the declining channel would test the June 2010 low:
For the rest of the post today I thought I would review some charts of foreign equities, which are mostly looking much weaker than US equities. I posted the chart for Spain a couple of weeks ago noting that it was close to a test of the 2009 lows and they are now being tested, and have been slightly undercut. There's some positive divergence on the daily RSI, and I think it may well bounce here for a while:

The UK chart also looks weak but may also be ready to rally here. The rising wedge forming from the October low is worth noting, so if we see a weekly close below rising support from the October low here then that would look bearish. Additional support is at the 100 WMA which is a decent bull/bear dividing line on FTSE. Worth noting as well is the H&S that may be forming there, with a target at the 2009 low, though if we see a move to shorter term rising wedge resistance, then that would evolve into a possible double-top, with a target at the 2009 low. It's also worth noting here that the target of the rising wedge that broke last year is at the 2009 low. The FTSE is not a longer term buy and hold recommend on a pattern basis here:

Moving on to EEM, some of you may recall that I was posting a potential H&S forming there last October, and that potential H&S is alive and well still. EEM is testing support from the October low at the moment, and on a break below would be a very brave looking long ('very brave looking' is Britspeak for stupid). If this H&S should play out the target would be just above the 2009 low:

Looking overall at the MSWORLD chart, which covers all equities outside the US, we have yet another potential H&S forming there, backed up by a declining channel with broken declining resistance from the 2007 high as current declining channel support. This one's well worth a look in detail as it is a simply lovely technical chart. The H&S target would be slightly below the 2009 low:
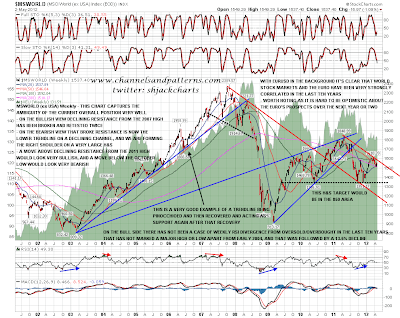
The reason I've been showing these foreign equity charts today is to balance them against the relatively bullish US equity charts. I'm expecting USD to outperform over the next year or two and would expect US equities to outperform with USD. Outperformance doesn't mean that US equities will necessarily go up, as the message from these ex-US index charts is that there is the technical setup here for a possible crash on the FTSE, EEM and MSWORLD charts, with Spain being the exception only because it has already crashed. This is the sort of technical setup that is best described as making any crash in the next year obvious in hindsight.
I'm cautiously bullish today and looking for a break over 1410 SPX to get more comfortably bullish. I'd be concerned about a move under 1397.50 ES this morning, and another test of support at 1390 would complete the potential H&S patterns forming on SPX and ES, which would look very short term bearish on a break below there with any confidence. If we see that break the H&S target on ES is in the 1370 area.
