
The Russell 2000 and The Transports Index were holding up relatively well in this downtrend, but that ended yesterday. On the RUT I've posted the H&S there a few times as it formed, and the downside target is at 720. On the chart you can see that the support broken yesterday was at the H&S neckline last year:

I was talking yesterday about how a definite close well below the lower bollinger band on SPX would be a signal that a short term low might be close. We saw that close yesterday and as SPX approaches the strong support level at at the 1292 October high, we're coming into an area where we might well see a bounce:

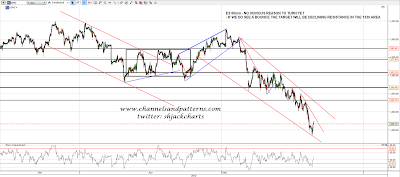
Overnight ES traded as low as 1293.50 overnight and has bounce strongly to 1308.25 at the time of writing. I can't see anything to suggest that this is the low yet, but if we are to see positive RSI divergence at the next low then we'd need a decent bounce beforehand to set that up. I we see that today then short term declining resistance is in the 1315 area and main declining resistance is in the 1330 area:
NQ has reached a possible bounce area at declining support and the 2500 level. I have declining resistance there in the 2560 area:

So what's happening on the star of this show, EURUSD? My declining channel support trendline has broken slightly, but EURUSD's descent has slowed dramatically in the last three days on increasing positive RSI divergence. We might see a bounce here, though I'm expecting a test of the January low soon and that hasn't been reached yet:

I'm doubtful about a significant change in trend before SPX reaches the twin pattern targets at 1292 and RUT reaches the H&S target there in the 720 area. The Dow looks like more downside is coming as well. Sell the rallies still IMO.
