
A Striking Chart From SocialTrade
Hey Fellow Slopers,
Checking Social Trade on Wednesday, I found this striking chart posted by INVESTNBEST, showing the secular bull market in 10-year Treasuries over the last three decades: (click to enlarge)
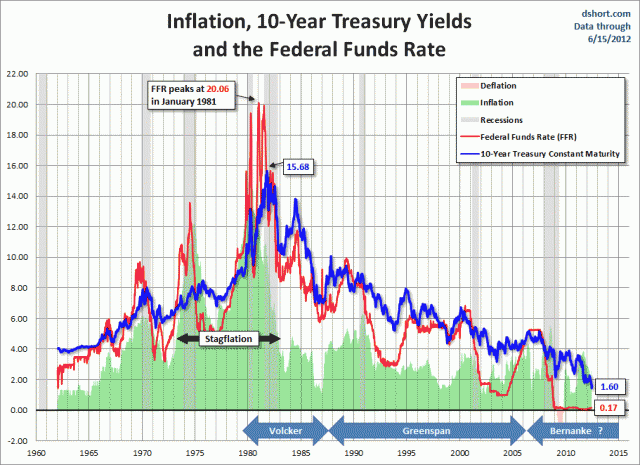
That reminded me of one of Tim's tweets from last month, which highlighted how extreme the recent lows in US Treasury yields have been:
Fun Fact: Interest rates on 10-year and 30-year U.S. debt isn't just at a 5-year or 10-year low. It's at a 220-year low (i.e. all time) $TLT
– Tim Knight (@SlopeOfHope) June 2, 2012
Hedging Treasuries via Optimal Puts on Proxy ETFs
In his tweet, Tim included the symbol for the ETF that tracks long-term U.S. Treasury bonds, the iShares Barclays 20+ Treasury Bond (TLT). Investors who own long term U.S. Treasury bonds can hedge their positions by purchasing optimal puts on the ETF TLT as a proxy. Similarly, investors who own 10-year U.S. Treasury debt (the subject of INVESTNBEST's Social Trade chart) can hedge by purchasing optimal puts on the iShares Barclays 7-10 Year Treasury ETF (IEF) (for a step-by-step example of using optimal puts on proxy ETFs to hedge, see this article published last summer, "After the Downgrade: Hedging U.S. Treasuries").
Even though the secular bull in Treasuries may seem a little long-in-the-tooth, and despite the prospect of more quantitative easing in the next few months, options investors apparently haven't priced in the risk of a significant correction in Treasuries over the next six months. For investors long 10-year or 30-year U.S. debt, or long the proxy ETFs, the table below shows the costs, as of Wednesday's close, of hedging TLT and IEF against greater-than-15% declines over the next several months, using optimal puts.
Comparisons
For comparison purposes, I've added the iShares iBoxx Investment Grade Corporate Bond ETF (LQD), and two high yield corporate ETFs: the iShares iBoxx High Yield (HYG) and the SPDR Barclays High Yield (JNK). First, a reminder about what optimal puts are, and a note about the 15% decline threshold I've used here. Then, a screen capture showing the optimal put to hedge IEF.
About Optimal Puts
Optimal puts are the ones that will give you the level of protection you want at the lowest possible cost. Portfolio Armor (available on the web and as an Apple iOS app), uses an algorithm developed by a finance Ph.D to sort through and analyze all of the available puts for your stocks and ETFs, scanning for the optimal ones.
Decline Thresholds
In this context, "threshold" refers to the maximum decline you are willing to risk in the value of your position in a security. You can enter any percentage you like for a decline threshold when scanning for optimal puts (the higher the percentage though, the greater the chance you will find optimal puts for your position).
Often, I use 20% thresholds when hedging equities, but since fixed income investors (with the possible exception of high yield investors) tend to have lower risk tolerances, I have used 15% decline thresholds for each of the names below.
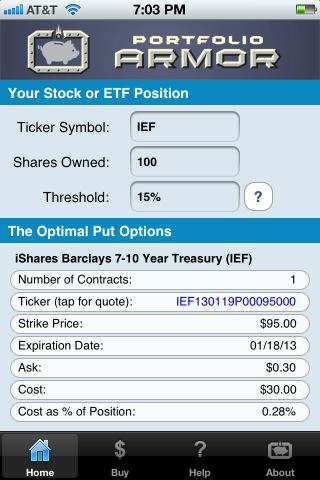
The optimal put to hedge IEF
Below is a screen capture showing the optimal put option contract to buy to hedge 100 shares of the iShares Barclays 7-10 Year Treasury ETF IEF against a greater-than-15% drop between now and January 18th. A note about these optimal put options and their cost. To be conservative, the app calculated the cost based on the ask price of the optimal puts. In practice, an investor can often purchase puts for a lower price, i.e., some price between the bid and the ask (the same is true of the other names in the table below).
Hedging Costs as of Wednesday's Close
The hedging costs below are as of Wednesday's close, and are presented as percentages of position values. These are the costs of hedging against greater-than-15% declines. It's worth noting that IEF and LQD are both inexpensive to hedge using 8% decline thresholds as well (IEF fell by slightly more than 8% between October, 2010 and February, 2011).
|
Symbol |
Name |
Hedging Cost |
| IEF | iShares Barclays 7-10 Year Treasury | 0.28%** |
| TLT | iShares Barclays 20+ Treas | 0.92%** |
| LQD | iShares iBoxx Invest Grade | 0.38%* |
| HYG | iShares iBoxx High Yield | 1.32%* |
| JNK | SPDR Barclays High Yield | 1.65%** |
*Based on optimal puts expiring in December
**Based on optimal puts expiring in January
