Further to my post of July 17th, once again, Oil finds itself testing rising channel support on the Weekly chart below. At the moment, it's trading in between the 50 sma (red) and the 200 sma (pink) in an attempt to break out of this range either to the upside or the downside. Its recent rally didn't quite make it all the way up to the "mean" (mid-Bollinger Band).

However, price on the Commodities ETF (DBC) and the AUD/USD forex pair Weekly charts below did manage to rally up to push slightly beyond their "mean", but pulled back to it on DBC and just above on AUD/USD in Monday's action.
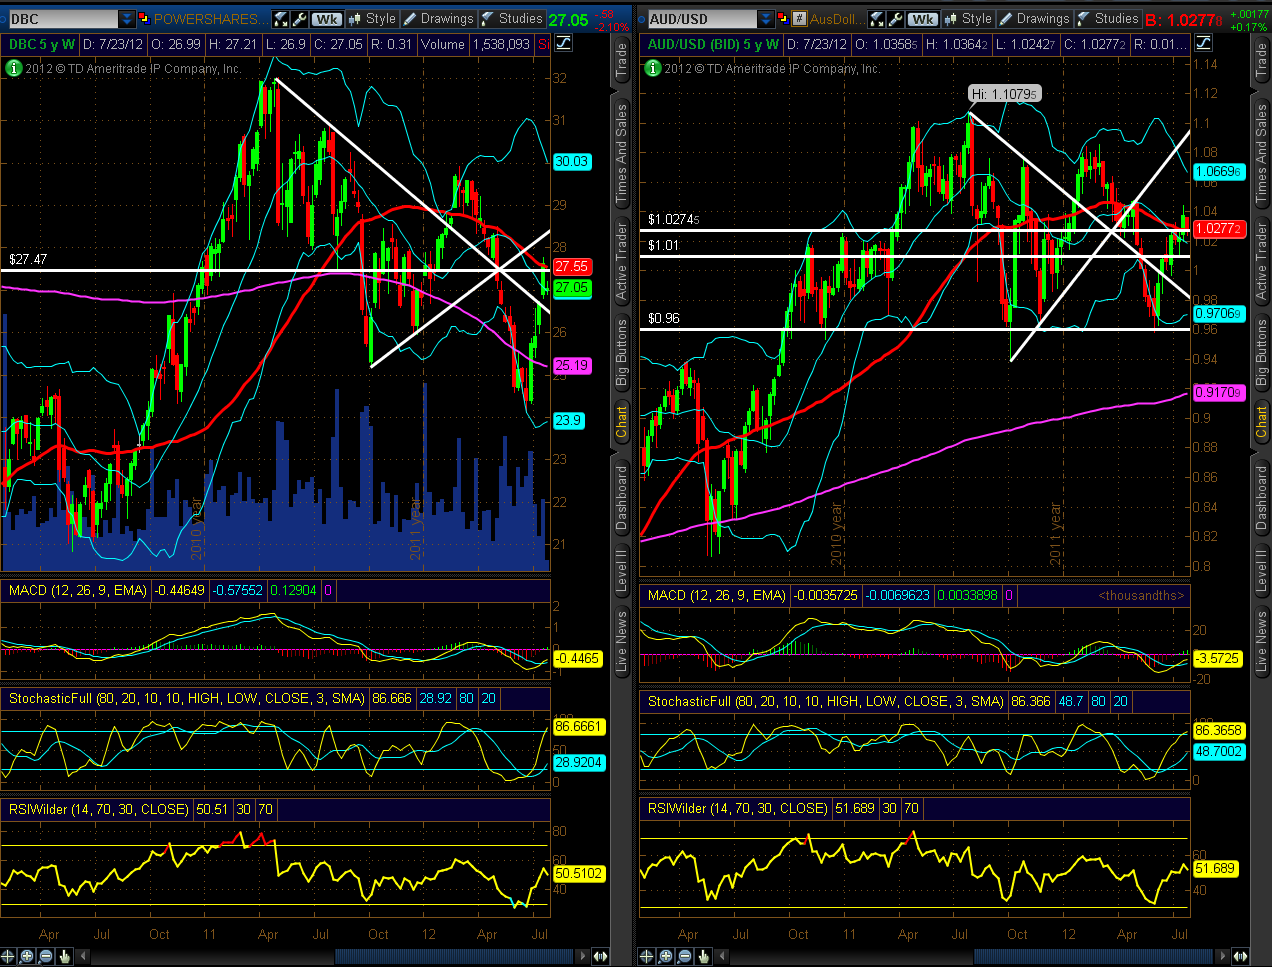
A failure to hold the channel support on Oil and the "mean" on DBC and AUD/USD could well send all of these back down to their lower Bollinger Band or lower. A move lower could negatively influence equities.
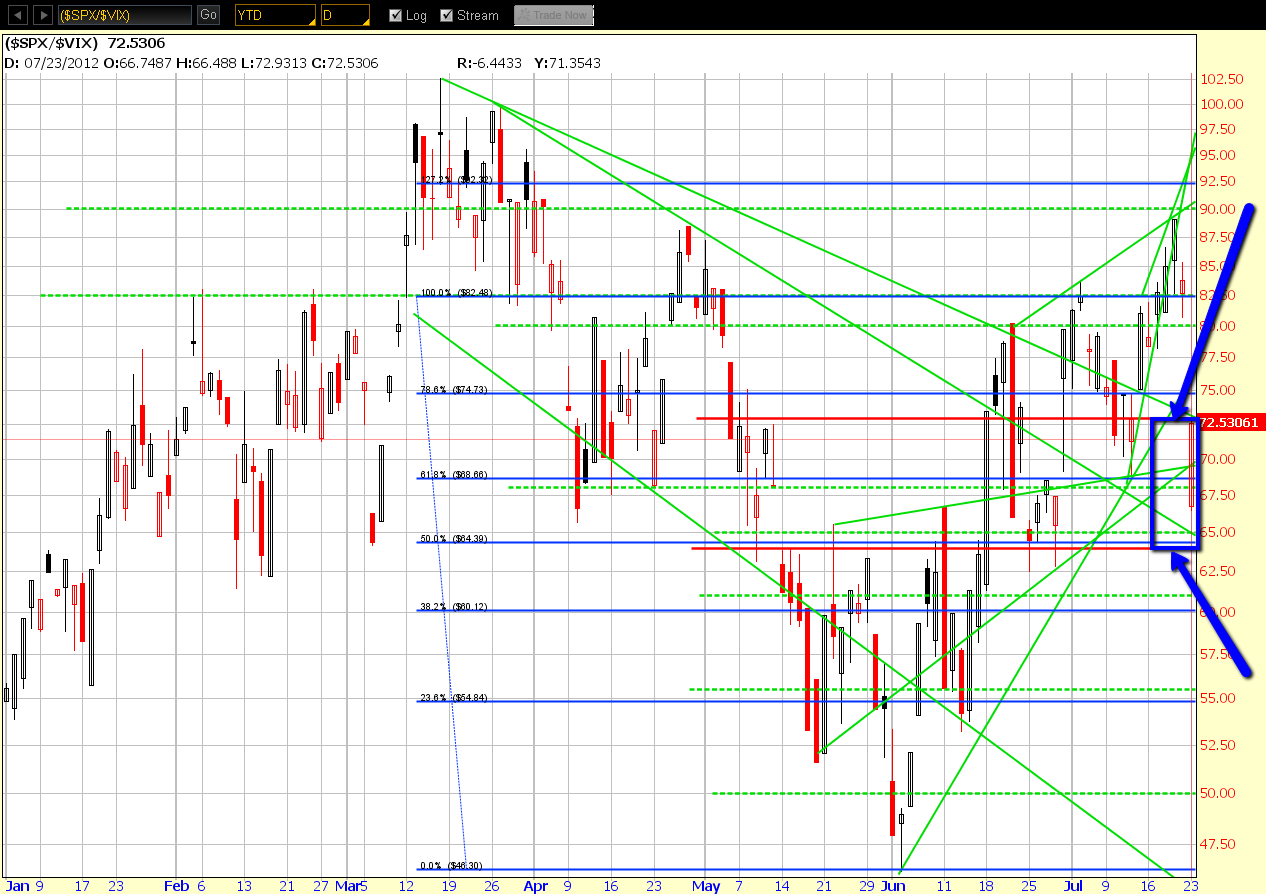
In this regard, 64.00 to 72.00 represents an important confluence zone for the SPX:VIX ratio pair….price closed just above 72.00 on Monday. A break and hold above 72.00 would send the SPX higher to, potentially, the last swing high, or higher, while a break and hold below 64.00 would send it lower to, potentially, the June lows, or lower…worth watching to gauge either a strengthening or further weakening in equities.