
There were a couple of developments yesterday that could be very important game-changers. The first from the Fed minutes is serious talk of implementing QE3 if the US economy continues to weaken, which seems likely. QE1 and QE2 both had a big impact on the equity and other markets and there's no reason to think that QE3 wouldn't have a big impact too.
The second was that the German representative on the ECB came out against the Bundesbank in favor of a European QE program that would buy up the bonds of troubled sovereigns as soon as the yields reached certain trigger thresholds.
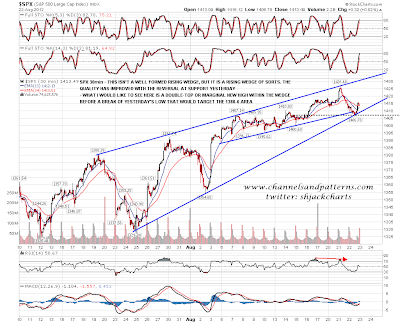
Together they amount to a position where we may see a wave of QE implemented in the US and Europe on a large scale. If so this could boost markets to the next bubble highs and, in the US, could push SPX to the test of the 2007 highs that I was talking about in my weekend post, in the event that 1440 area SPX resistance is broken. You can see that post here:
None of this may happen of course. In the case of the Germans this looks like electoral suicide for the government there, and will at the least be most unpopular in Germany. They may well pull back from this or the German representative on the ECB may not have been speaking with Merkel's backing. In the US the Republicans may win the election. Obama's doing OK at the polls so far, but most sitting presidents in the past looking for a second term with a grim economic backdrop have lost. If Romney wins then the Fed's wings may well be clipped and the autonomy to carry out actions like QE3 severely reduced. In that case there may be no QE3.
We shall see. Short term ES made a nice W bottom yesterday on positive 60min RSI divergence and made the 1417.75 pattern target overnight. I posted that target on twitter yesterday afternoon. These patterns are very classical topping (M) or bottoming (W) patterns and always worth looking out for. On the slightly bigger picture I'm thinking the spike into yesterday's low may have been the valley low on a double or M top, and if so we may retest the highs or push a few points beyond. I have put a box round yesterday's W bottom on ES for anyone who wants a closer look:

ES broke trendline support yesterday for a while but SPX did not though the trendline was frayed sightly. That trendline is in the 1409-10 SPX area today and if we see an hourly close below that then most likely we won't see any test of the highs before this retracement has played out:
EURUSD held the 1.444 level I mentioned yesterday on an hourly close basis, and the bull flag played out. The 1.25 W bottom target was made and the rising wedge upper trendline (now) at 1.259 was almost reached. RSI looks promising for reversal there, though I mentioned on the chart that it's worth noting that while 69% of rising wedges break down, that means 31% break up:

Looking at the USD chart, which plunged after the Fed minutes yesterday, the IHS neckline is being tested again. There is the worrying look of a classical M top to this chart, with the marginal new high and resistance break on negative RSI divergence, and I am concerned that we may see a breakdown here. If the neckline doesn't hold then have rising channel support from the 2011 lows in the 80.4 area. If that breaks then the USD uptrend may be over, and the M top target would be in the 78.1 area:

TLT broke back above broken resistance at 123.5 to 124 yesterday, which was interesting. If it can hold above then the plunge on TLT from the H&S may just have been a retracement. There are two gap fill targets above that I have marked on the chart:

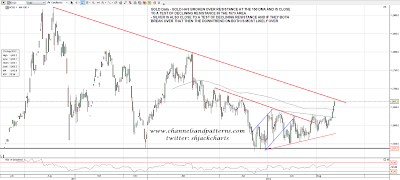
Gold was the big winner yesterday, as buyers flooded in to a long term store of value that can't be printed by demented central bankers. Gold broke over the very important 150 DMA and is close to a test of declining resistance from the high in the 1673 area. Silver is close to a similar test and if both break over those then the pullback in precious metals is most likely over:
I've been talking a lot about forms of double-tops and bottoms today as they are a very common reversal setup and always well worth looking out for. We saw examples at the SPX low last year, the TLT and USD highs (so far and not played out yet) this year, the EURUSD low on Monday. Typically they involve either two peaks or troughs at the same level, or a marginal new high on negative RSI divergence at a high, or a marginal new low on positive RSI divergence on a low. Yesterday's low on ES was a perfect example on the 60min chart. These often mark major reversals that run a considerable distance.
On the broader markets we may well be seeing a shift in the policy backdrop that could give equities and precious metals particularly a major boost. I don't think this changes whether we are going to see (or have already seen) a swing high in the SPX 1420-1445 range, but it may change what happens when SPX nears support on the next retracement. As long as support holds on the main SPX rising channel, currently slightly over 1370, the overall trend should be assumed to be up. Only on a break below there do the pattern setups suggesting that we may see major falls across the board really come into play.
