
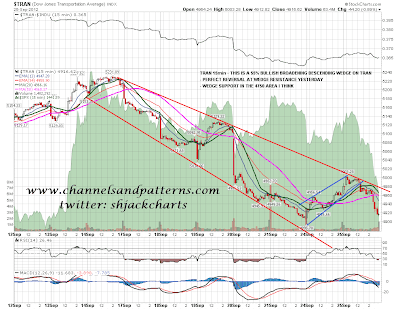
Well I led with the TRAN chart yesterday morning and we saw a perfect and strong reversal at wedge resistance there yesterday. I have wedge support in the 4750 area, though that might not be reached of course, and I think this is most likely the key chart to watch for a signal as and when this retracement on equities finishes. Meanwhile we are now firmly back on my original script for the post QE3 announcement retracement:
On the SPX daily chart we are seeing a test of support at the middle bollinger band and the broken SPX 1440 area pivot. I am expecting this to break, though possibly not today, and my preferred retracement target is at the channel support trendline marked on the chart:

Looking more closely at that SPX rising channel on the 60min chart I have channel support at 1408 now. My ideal retracement target would be an intersection of SPX channel support and the SPX daily lower bollinger band in the 1410 ES area in the first three days of next week. We'll see how that goes:

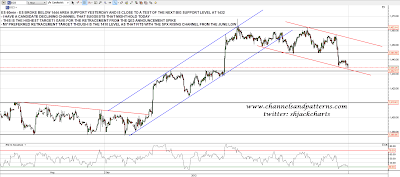
On the ES 60min chart I have two strong support levels above 1410 and the first at 1444.5 was broken yesterday. The second is at 1432 ES, roughly at the retest of the SPX 1440 pivot and I have a candidate channel suggesting that we could see a bounce there. If we did that would be on positive 60min RSI divergence and I'd then expect a test of channel resistance, possibly with a retest of broken 1444 support in a day or so:
I had a comment yesterday that the double-bottom setup on CL that I showed yesterday morning could also be seen as a bear flag. Obviously that's right and the key thing to watch there is whether the pattern valley high is broken to make a short term higher high. Bulkowski says that 65% of these setups never manage that and this one didn't either. CL is now testing support at 90, and on a break below I have decent support levels at 87.5 and 85. Any lower than 85 invites a full retracement of the move up from the June lows under 80:

EURUSD reversed at the declining resistance level I gave yesterday and we now have a decent resistance trendline to signal when this retracement is over. My support levels target I gave last week has now been reached at the 200 DMA and broken rising wedge resistance, but there are currently no signs to suggest reversal there. If that breaks I have next big support at rising support from the July lows, and that trendline is currently in the 1.264 area. I can say that there is some political risk here on EURUSD because I am a master of the understatement:

I'm expecting more downside but ES may find short term support at the strong 1432 support level. On an hourly close below I would expect follow-through to the downside. I would like to see my possible declining channel on ES broken quickly. Until it has been broken though that should also be borne in mind.
