Data released
on Wednesday shows a continued decline in China's GDP, which
began in April 2010, as shown on the graph below. There were only two quarters
with lower GDP numbers since January 2009.

Slope initially began as a blog, so this is where most of the website’s content resides. Here we have tens of thousands of posts dating back over a decade. These are listed in reverse chronological order. Click on any category icon below to see posts tagged with that particular subject, or click on a word in the category cloud on the right side of the screen for more specific choices.
This chart pretty much speaks for itself. The only question that one
must ask when trying to formulate their overall market bias is: “Will it
really be different this time around?”. Remember, Denial ain’t just a
river in egypt.
-Mark Twain
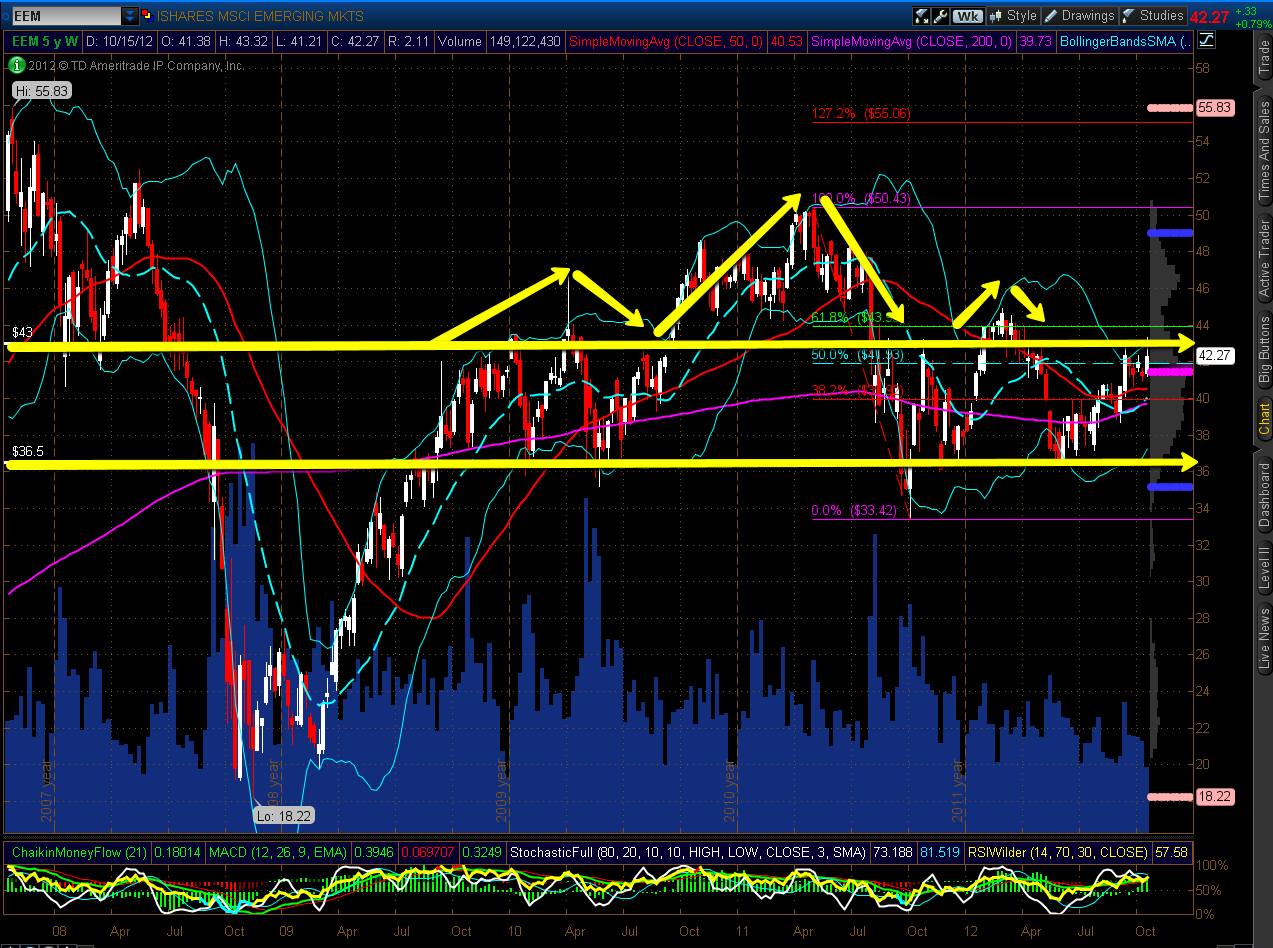
Below are a Weekly chart and Daily chart of the Emerging Markets ETF
(EEM).
A very large Head and Shoulders pattern
has been building on the Weekly timeframe since September 2009.
Price is retesting a zone in the vicinity of the right shoulder and appears
poised for another attempt at a break above.
Within the right
shoulder is another smaller Head and Shoulders pattern, which
has been building since August 2011 on the Daily timeframe.
Price is retesting the September 14th "shooting star," the high of which
represents the top of the right shoulder (which is still forming) on this timeframe. Furthermore, a
bullish moving average "Golden Cross" formed two days ago, and,
once again, price closed just above the 50% Fibonacci retracement level today.
Volumes have picked up a bit over the past couple of days.
If price
breaks and holds above 43.00, the next level of resistance is
the top of the Daily "head" and Weekly "right shoulder" at
44.91 (if it can make it above the 60% Fib level at
43.93).

You can see how
EEM is performing compared to the BRIC
countries, as shown on the 6-Month Daily charts below.
If we see India and China weaken, we may see the others, including EEM,
follow suit. All five bear a close watch over the next few days, as any
weakening, in the near-term, may negatively affect U.S.
equities.

SPX didn't retrace much yesterday and continued upwards. The target is the upper bollinger band area just below 1470 and we're getting close now:

