
I've been running a lot of charts this morning and have narrowed the field down to ten I'd like to post today. That's rather too many, so I'll post five here and the rest on twitter later.
On the SPX daily chart there was a clear break over resistance ant the middle bollinger band yesterday and that should be support on a closing basis today in the 1448 SPX area. The next target up is the upper bollinger band, currently at 1468, and that is the retest of the highs area that I was talking about yesterday. Barring a major reversal today that's what I'm expecting to see on Friday or Monday:

Short term ES and SPX are now overbought on the 60min RSI and we may see some retracement before the run to the highs. On ES there is some negative RSI divergence and a double or M top may be forming that would target the 1439/40 area on a break below 1446. That would fit with a retest of the W bottom neckline at 1439.25 and I'd be looking for reversal back up there if we reach that. There is of course a significant support/resistance level at 1444.50 though and that could hold:
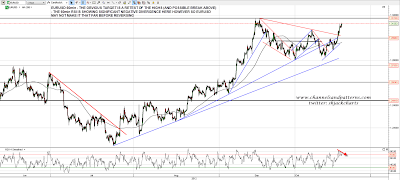
EURUSD has made it most of the way back to the current rally high now, but is also looking short term toppy. On the bigger picture it's worth noting that a reversal near the last high would set up a possible double-top that would target strong support in the 1.244 area on a break below 1.288, and EURUSD is close enough to qualify for that already. As nothing has actually been fixed yet in the Eurozone that's definitely worth bearing in mind here:
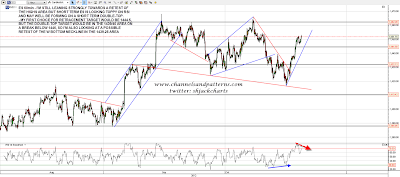
TLT has reversed back below the broken falling wedge resistance trendline and has hit the 122 area I was suggesting as a target on Monday. On balance I'm expecting more downside, so I should mention that on a break below 120.92 a double-top setup would trigger that would target the 117 area. That might also have larger implications, as the break above wedge resistance this week would then look like a wedge overthrow, suggesting that this falling wedge may well break downwards in a move that would target the high 90s on TLT. These wedges break down 31% of the time of course and in my experience are rather better at reaching target when they do. Food for thought:

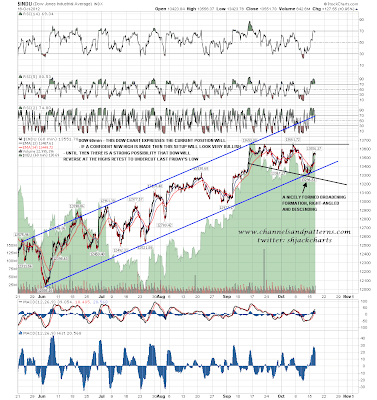
If the current highs are retested on this move then whether we see a break upwards or not there is very important. A conviction break upwards would indicate considerably higher, and a big reversal might well undercut last Friday's low. That is well expressed on the Dow 60min chart, which I'll close with today. You can see that there is a type of triangle on the chart, which has the very user-unfriendly name of right-angled and descending broadening formation, and the trigger level for this pattern is in the current highs area. I'm leaning towards another reversal back down from the highs test but it could certainly go the other way:
I would be surprised to see this move end here and will be expecting to see SPX back in the 1460s this week unless we see strong evidence to the contrary. We may well see early weakness today and that will look like a buyable dip with the likely target on ES being either of the 1444.5 or 1439 areas. I will be posting charts on AAPL, TRAN, SPX 60min, GLD and GDX on twitter after the open today.
