
I think AAPL is a great company. My family own three iPads, two iPhones and I've even toyed with the idea of buying one of their desktop computers. A year after the death of Steve Jobs AAPL is looking stronger than ever, with just a minor couple of glitches at the launch of the new iPhone as their competition with Google intensifies. I won't be upgrading the OS on my iPhone until there is a Google Maps app but that is a minor irritation.
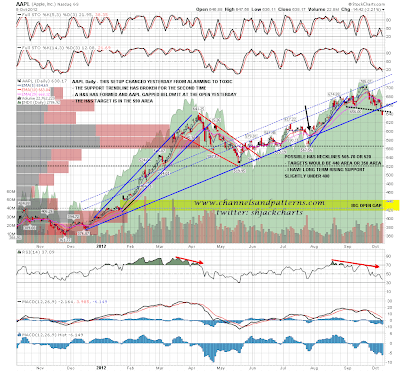
As well as an AAPL admirer though I am also a chartist, and my strong belief is that the charts should lead without the chartist imposing any preconceptions on where they should be heading. I therefore posted a couple of charts on 13th September mentioning that the setup on AAPL was looking potentially bearish. You can see that post here. I then wrote follow up posts on 2nd and 4th October talking about the alarming RSI setup on the weekly chart and the retracements that this has always led to in the past, and the possible sloping H&S that was forming on the daily chart. You can see those posts here and here.
It is an article of faith for many that AAPL cannot go down much, and I had my only abusive comment of the year from a reader after the 13th September post which I ascribed to my heretical bearish comments about AAPL that day. What I have to say today, at the risk of inviting a fatwa from outraged AAPL shareholders, is that the AAPL chart has progressed from looking alarming to positively toxic, as the rising support trendline I was talking about has broken for a second time, and the possible H&S I was looking at has completed by gapping under the pattern neckline at the open yesterday.
The H&S target on AAPL is at 590. I don't know if it will make it, but the setup is good and I would normally expect a pattern like this to make target. Obviously that may have wider implications for equity markets as AAPL is a large component in both the Nasdaq and the S&P 500. I'll keep you posted on developments:
Moving on to the rest of the market SPX found support at the middle bollinger band on the daily chart yesterday. This is obvious support and (AAPL permitting) we may see a decent bounce up from there:

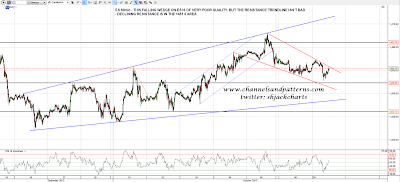
On the ES 60min chart a very poor quality falling wedge has formed, and since I capped the chart below it has broken up through declining resistance from the high. There is significant resistance at 1454.5 and a break over there would deliver a short term higher high:
I was looking at TRAN again this morning and the retracement from 5082 there was a retest of a broken resistance trendline. There is a W bottom target there in the 5130 area that is still in play:

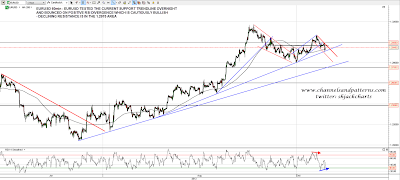
EURUSD tested the support trendline I was talking about yesterday morning on positive RSI divergence. That looks cautiously bullish and I'll be watching to see whether EURUSD can break back over declining resistance in the 1.2975 area:
On CL another test of declining resistance in the 90.75 area looks imminent and a break above would suggest a test of the possible IHS neckline in the 93.4 area:

Gold is stalled at 1800 resistance on negative RSI divergence and an H&S may be forming there, though it is still currently at the wild speculation stage. The pattern neckline is in the 1740 area and a return there to complete the head would look very promising for a subsequent retracement into the high 1600s. A bounce at 1740 would suggest a late stage H&S, and a break below would be an M top. Either way the downside target would be in the 1680-90 area:

ES is looking strong this morning and EURUSD may have made a significant short term low. A break over 1454.5 ES would suggest at least some further upside, and breaks over declining resistance on EURUSD and CL would reinforce that considerably. Until we see those breaks though the toxic setup on AAPL has me very concerned about the bull side today and over the next couple of weeks, and even with those breaks any bounce here may only last a day or two.
