
SPX closed the week five points under the weekly upper bollinger band, delivering a sixth straight week with a close near this level. The weekly upper BB is rising at about ten points per week so if this continues for a seventh week the likely closing range would be in the 1528 – 1534 area:
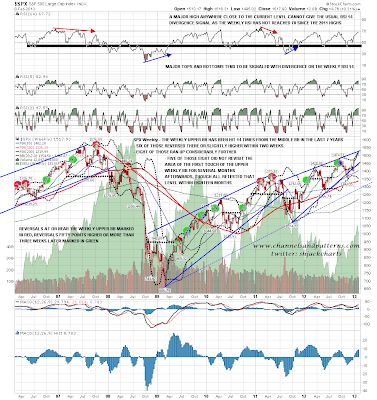
On the 60min chart resistance on SPX (and ES) was broken and the close was slightly above it. Negative RSI divergence should now be disregarded so there is no current 60min sell signal and no trendline resistance under the 1532 area:

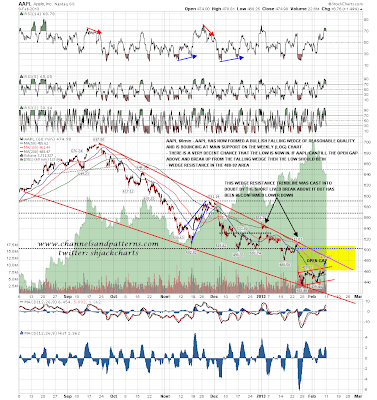
AAPL is nearing falling wedge resistance in the 488-92 area. If we see a break up back over 500 that should mean that the decline on AAPL is over:
Stepping through the looking glass into the parallel universe occupied by non-equity markets last week there is an increasingly strong bottoming setup here on TLT. If TLT can break back up over declining resistance in the 118.5 area the next obvious target would be the possible IHS neckline in the 120.4 area:

On CL the candidate H&S that I've been following is now almost complete. If we see a break below 95 I have the target in the 92 to 92.25 area. This is a nice looking pattern following a strong uptrend and with negative divergence on the daily RSI. This may well play out:

EURUSD looks the strongest of the three this morning. It is in a downtrend, and has formed a declining channel on the way to obvious downside targets that have not yet been hit, but there was clear positive RSI divergence at the last low. I'm looking for a move back to test channel resistance in the 1.3475 to 1.35 area and a possible break up from the channel:

After the resistance break late last week I'd be surprised not to see at least some follow-through this week. The SPX 1525-30 area looks like a good selling zone. Support on ES is at 1511, 1509 area and 1503.5.
