
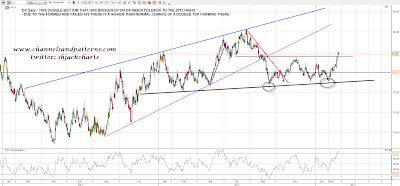
ES made a high yesterday with some negative 60min RSI divergence and that high was within the range for a decent double-top. The double-top target is at 1460. ES is rallying at the moment but it looks like a bear flag and I'm assuming more downside soon. There is no positive divergence on the 60min RSI to warn of any low and there's no reason to think that the double-top won't play out further. First resistance in the 1495 area at the double-top valley low and on a break above the 50 HMA is at 1503.75:

The ES double-top is mirrored on the SPX chart, where the target is 1465. There is possible support at rising support from the November low in the 1470-5 area:
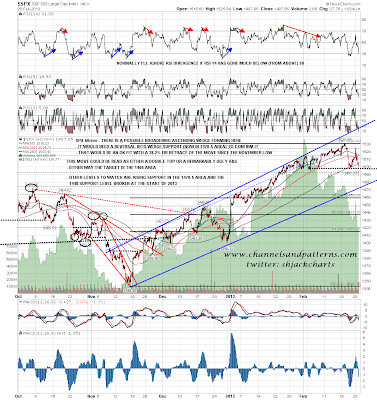
Looking at the SPX multi-timeframe charts there are two obvious levels with decent support, and on the SPX daily chart they are represented by the 50 DMA at 1476, fitting with rising support from November, and the 100 DMA at 1446, fitting with the weekly middle bollinger band and broken resistance from the start of 2013. The obvious downside target is one or the other. The double-top target fits with the lower support level, and the stats for the weekly bollinger band slightly favor the higher. On the daily chart below you can see that SPX closed below the daily bollinger band yesterday and that favors a more two way action decline going forward from here:

On the weekly chart the middle bollinger band is now at 1448:

On other markets the double-bottom on TLT that I've been watching broke up and almost made target yesterday. The obvious upside target here in my view is the possible H&S neckline near 120.4 or the gap fill just above that:

CL made the little IHS target yesterday before the downtrend resumed. CL is now hitting significant support at the resistance zone for the Oct to Dec 2012 bottom:

EURUSD also resumed the downtrend there but instead of the EURUSD chart I'll look at the DX chart today for the bigger picture. There we can see that DX has broken up from the double-bottom that I have shown before, and has moved above the potential failure area just above the pattern trigger level. The target is the 2012 highs and I can see no reason to think that DX won't get there. The formed and failed H&S setup gives a higher probability in my view that the retest of the 2012 high will deliver the second high of a double-top:
As I have been mentioning, this recent high is only an interim high in my view and I'm expecting new post crash highs on SPX after this retracement. Most likely one of the two big support levels in the 1475 and 1450 SPX areas will hold, and on balance I slightly favor the lower target. For today I think ES is in a counter-trend bounce and the obvious failure levels for that bounce are 1495 and just over 1500 (ES).
