
ES and SPX broke the current uptrend with a lower low yesterday. On ES this was a momentary break below 1491 support. We're seeing a strong bounce at the moment, signaled by RSI divergence and a W bottom on the ES 60min chart at the low yesterday, but the chances are that an interim top is now in or being made. An H&S may also be forming:
Why does this look so significant? Well I mentioned a couple of weeks ago and last week when we were seeing potential topping setups that there was no negative RSI divergence on the SPX daily chart. That is no longer true. On the chart below there have been three instances since July 2011 where there has been clear negative RSI divergence from overbought on the daily chart and the smallest of those retracements made it to the daily lower bollinger band, which is now in the 1445-50 area:
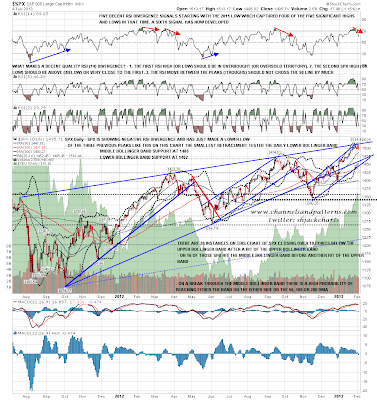
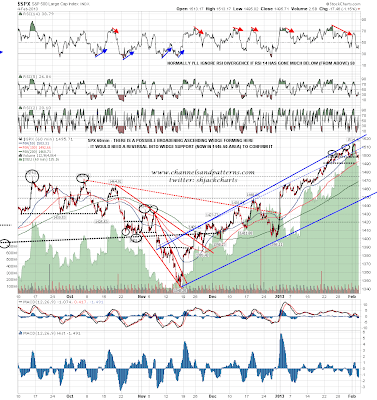
On the SPX 60min chart the rising support trendline from the November low is the obvious target on a decent retracement. That is also now in the 1445-50 area, and could be the lower trendline on a bearish broadening ascending wedge that may be forming on the SPX chart:
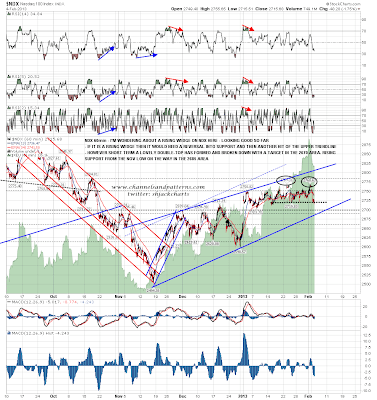
Is there any support for this from other indices? Yes. There are similar divergences on the Dow, RUT and Tran charts. Nothing on NDX but then it has been too weak for the daily RSI to get back over 70. What we do have on NDX however is a perfect double-top that broke down yesterday with a target in the 2670 area. There is possible support on the way at rising support from the November low in the 2685 area:
EURUSD made the double-top target yesterday and reversed off support just under 1.35. Short term rising support was broken and we may well see more downside after the oversold bounce:

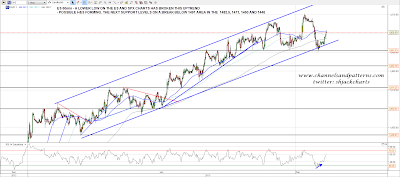
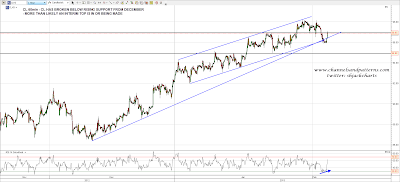
CL didn't make the double-top target in the 95 support area but did break rising support from December. Again an interim top may be in though I'm wondering about another possible test of 98 area resistance which would be a nice looking short entry if we see it:
The setup on equities here has me leaning strongly swing short here. Immediate resistance on ES is in the 1501 area at the 50 hour MA, and that's holding at the moment. It may well continue to hold. If we see a decent break above we might see a retest of the highs and I'd be looking for the second high of a double-top there. Either way this is by far the best short setup that we have seen so far in 2013, and historically it should deliver a 50 point or so retracement, and perhaps more. Sell the rips.
