
Further to my last Weekly Market Update, this week’s update will look at:
- 6 Major Indices
- 9 Major Sectors
- Commodities, Homebuilders, USD, & USB vs. Major Indices vs. Major Sectors
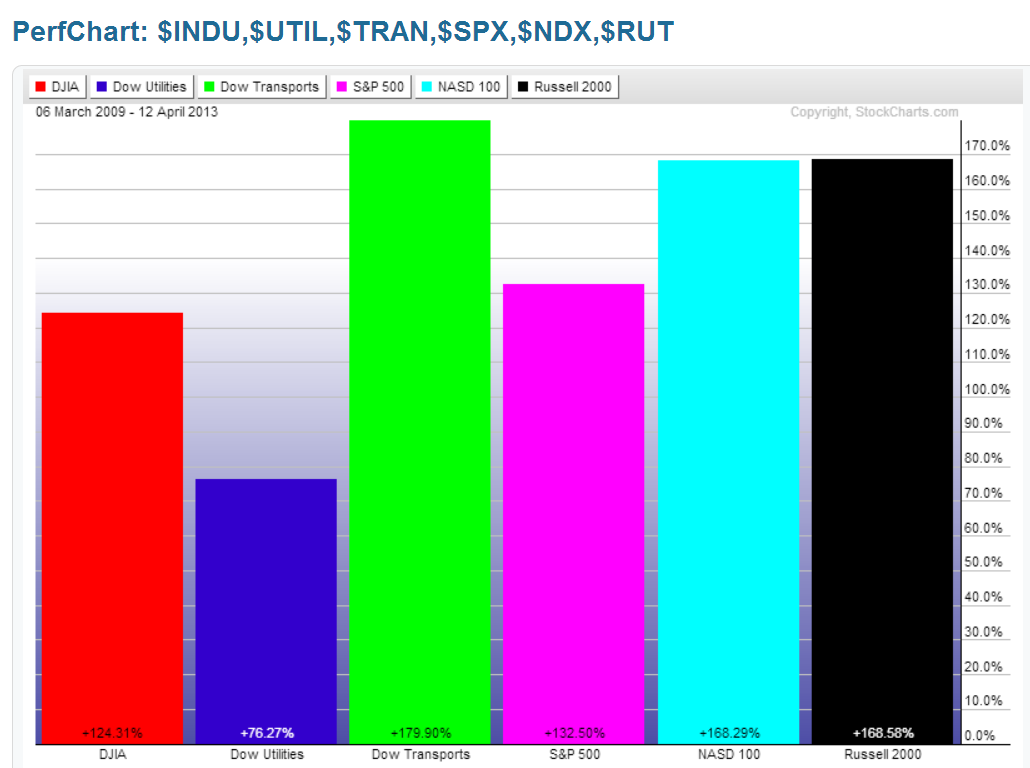
6 Major Indices
As shown on the Weekly charts and the percentage gained/lost graph below of the Major Indices, the largest gains this past week were made in the Nasdaq 100, followed by the S&P 500, Russell 2000, Dow 30, Dow Transports, and Dow Utilities. All are still running in overbought territory on the weekly Stochastics indicator. The S&P 500 finally reached an all-time high and closing high (along with the Dow 30).


9 Major Sectors
As shown on the Weekly charts and the percentage gained/lost graph below of the Major Sectors, the largest gains made this week were in Cyclicals, followed by Health Care, Consumer Staples, Financials, Technology, Industrials, Utilities, Materials, and Energy, as buyers added more ‘risk.’ All are still running in overbought territory on the weekly Stochastics indicator.


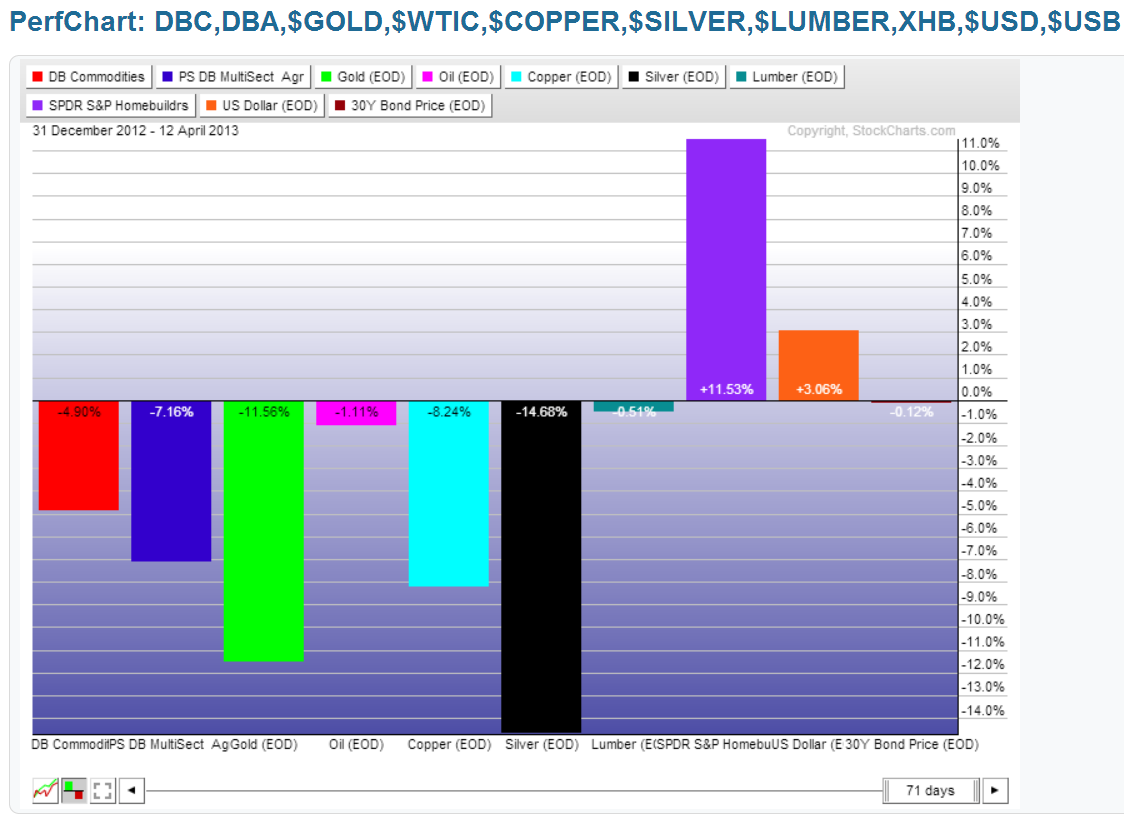
Commodities, Homebuilders, USD, & USB vs. Major Indices vs. Major Sectors
This week I’m looking at a comparison of percentage gained/lost of a variety of commodities, the Homebuilders Sector, the US $, 30-Year Bonds vs. the Major Indices vs. the Major Sectors.
The first 3 graphs show the timeperiod from the March 6, 2009 lows made by the SPX to today’s (Friday’s) close.


The second 3 graphs show the Year-to-date timeperiod.


The last graph shows the gains/losses made this past week on only the commodities through to USB, since you can find the 1-week graphs of the Major Indices and Major Sectors above.

In analyzing the above graphs showing their 3 different timeperiods, I would note the following observations:
- The Dow Transports have been playing leap-frog in terms of leadership with the Nasdaq 100 and Russell 2000 during those three timeperiods.
- Cyclicals and Financials have been strong performers in all three timeperiods; however, the ‘defensive’ Sectors (Consumer Staples, Health Care & Utilities) have outperformed the other Sectors for 2013.
- The Homebuilders Sector has been outperforming the commodities during all three timeperiods.
- Copper was holding up until 2013, but is now trading in negative territory for the Year-to-date timeperiod, as are Lumber, Gold, Silver, Oil, DBC & DBA.
- Gold, Silver and Oil were particularly hard-hit this week, while Lumber lost 1.34%.
- The US $ is down 7% from the March 2009 SPX lows, while 30-Year Bonds are up 14%. The US $ is, however, up 3% for 2013, while Bonds are flat for the year…so, a bit of rotation going on this year in these two instruments, while money was favouring the Large-Cap Indices and Transports, as well as the ‘defensive’ Sectors.
- However, buying got a bit more aggressive this week in the Technology and Small-Cap Indices, as well as the ‘riskier’ Sectors.
Summary
From the above observations, I’d keep an eye on:
- Small-Caps vs. Large-Caps — relative strength vs. weakness — as I’ve mentioned recently in this post, I’d find it difficult to support any kind of sustained buying in equities without a strengthening in Technology and Small-Caps, particularly with the SPX in the vicinity of a 13-year triple-top formation, and with the NDX facing a triple-top, as I described in this post.
- ‘Defensive’ Sectors vs. ‘Riskier’ Sectors — will the recent buying pick up in the ‘Riskier’ Sectors?
- Transports Index — will the strength continue?
- Homebuilders Sector — will it continue rising if Copper and Lumber continue falling?
- If the Homebuilders Sector falls, will the Financials also drop or vice versa?
- Gold, Silver and Oil — will their recent weakness continue — if so, will they finally have a negative impact on the Major Indices — see the “Comparison of SPX, CRX, USD & USB” section in my last Weekly Market Update post — I made the case for a negative impact on equities if Gold and the CRX continued to drop.
- US $ and 30-Year Bonds — will bulls abandon these or continue to accumulate them as a potential hedge against an equity downturn?
- The SPX, NDX & RUT vs. their Volatility Indices — see my post of April 9th — will they regain control and dominance over volatility as their ratio pairs trade at their respective resistance levels?
Next week (Wednesday at 2:00 pm EST), we’ll see the release of the Beige Book information with details on the latest economic conditions, which may offer some clues in answer to my questions. Friday is monthly Options Expiration, so we we may see an increase in volatility during the week as traders rotate out of and into various instruments. And, of course, we’re in the midst of earnings season for Q1 of 2013, so we may see added volatility in that regard.
Enjoy your weekend and good luck next week!
