
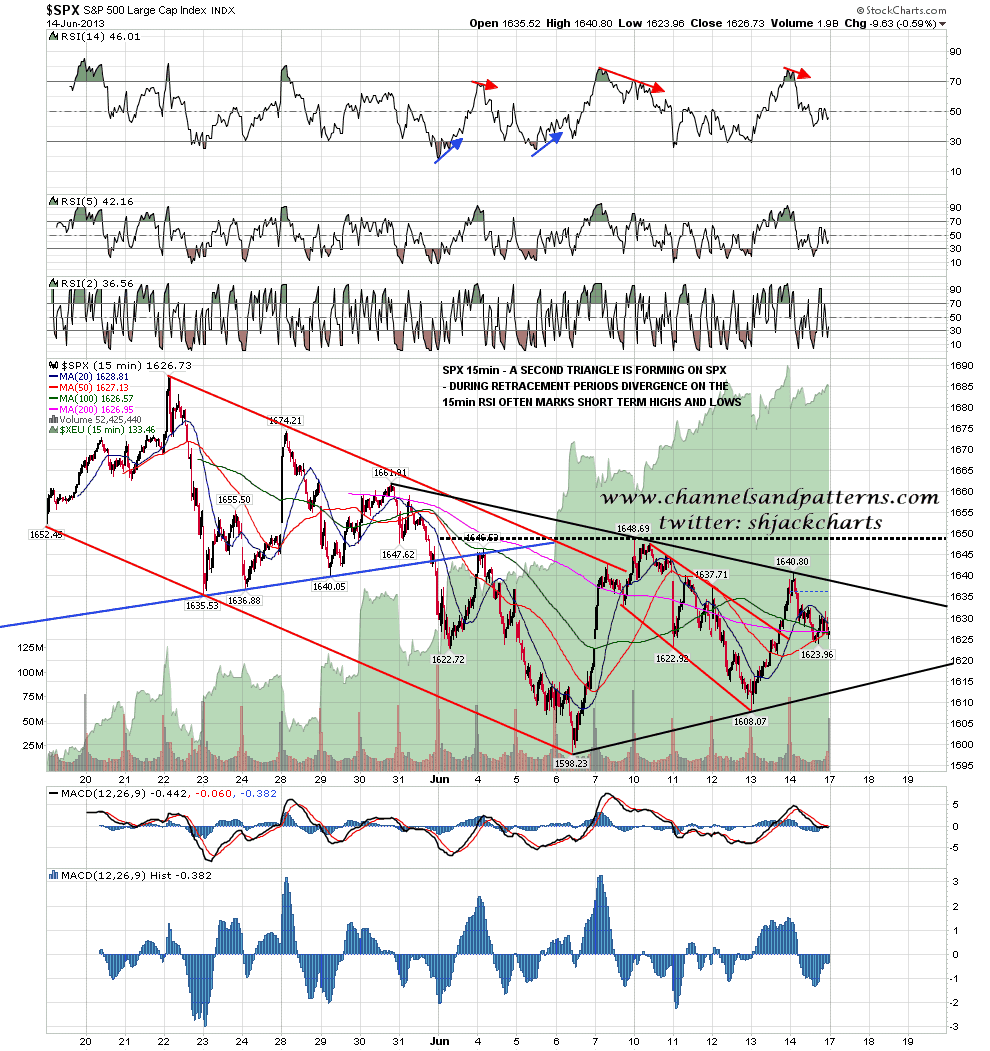
I posted a couple of charts on twitter after the close on Friday, and the first was the direction neutral symmetrical triangle that is now clearly forming on the SPX 15min chart:
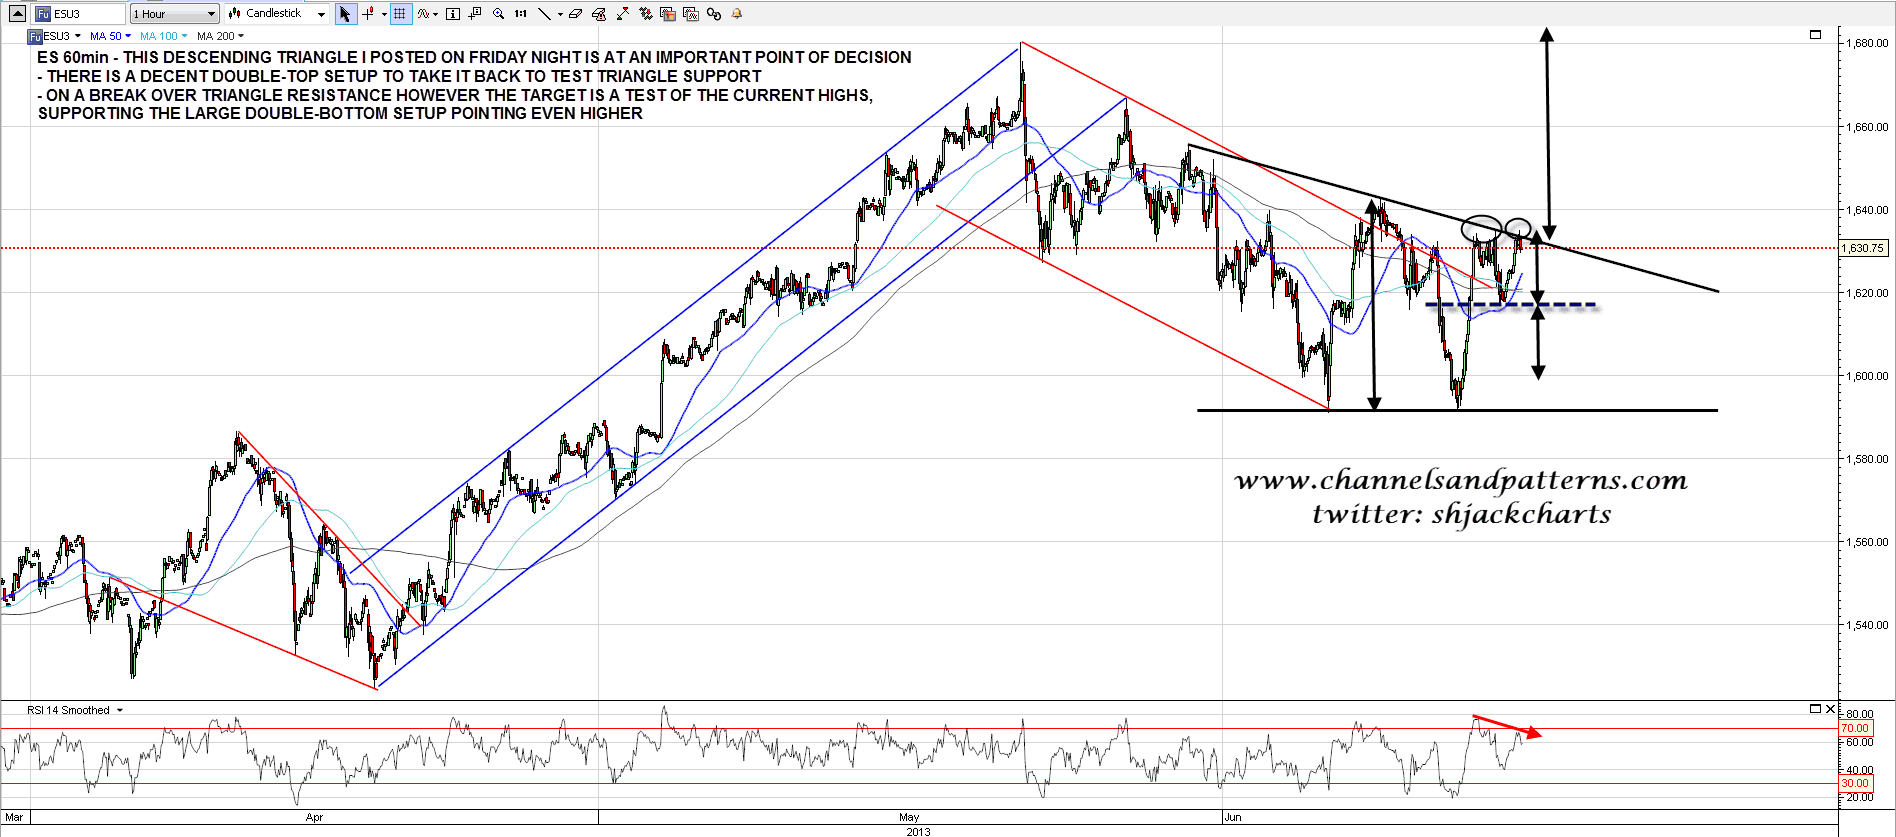
The second chart I posted was the triangle forming on ES, but in this case the triangle is a 64% bearish descending triangle, though obviously these do break upwards 36% of the time. After seeing some strength overnight ES is now poised between strong short term bull and bear scenarios.
The bear scenario is that the nice looking short term double-top breaks down and ES moves towards a test of triangle support in the 1591.5 area. The bull scenario is that ES breaks over triangle resistance and the triangle target would then be slightly over 1680, supporting the larger double-bottom setup targeting the 1692 area. ES 60min chart:
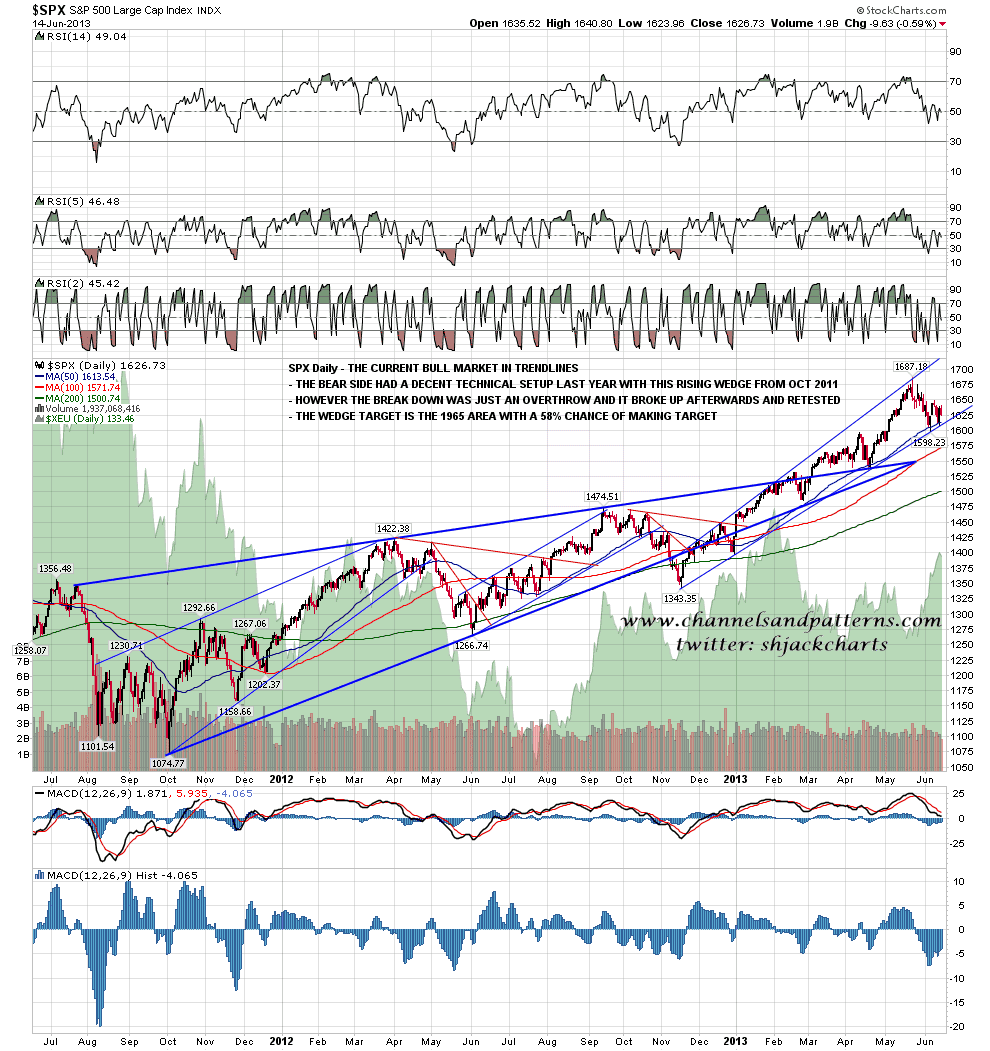
Of course this triangle has the usual triangle health warning that triangles are prone to making false breaks one way before resolving in the other. Rising and falling wedges are also variants of triangles of course and on wedges these false breaks are called overthrows. I showed the Dow rising wedge that broke up this year on my secular cycles post yesterday, and there was of course another rising wedge on SPX that broke down before resolving upwards. Here is the SPX rising wedge that I didn’t show yesterday, and the wedge target is the 1965 area with a 58% chance of making target. SPX daily chart:
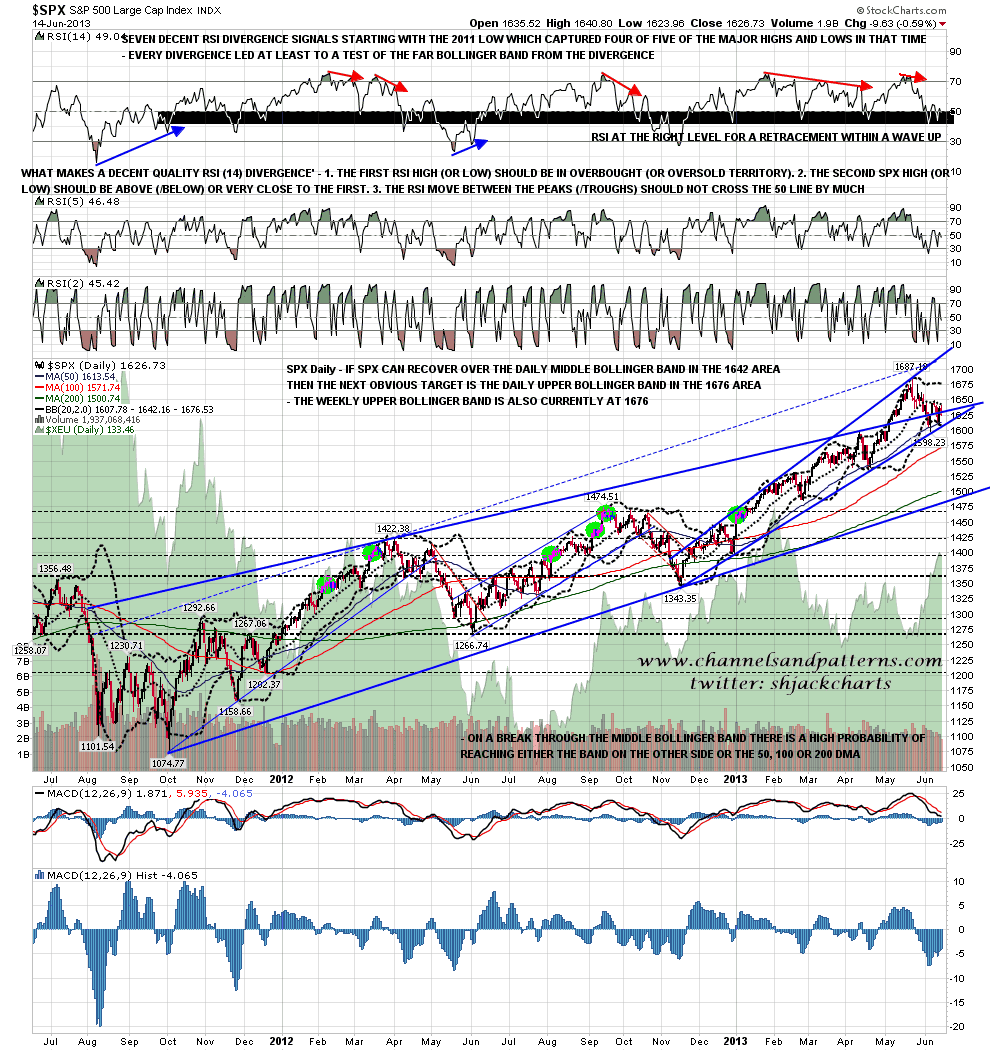
The ES targets on a break upward today are over the current highs, but there is some decent resistance worth mentioning on the way. The SPX daily middle bollinger band is now at 1642, and that is worth watching, but on a strong break above the daily and weekly upper bollinger bands are both now in the 1676 area. Obvious these should move up to an extent with any strong move up, but I wouldn’t expect to see the weekly upper bollinger band much over 1685 by the end of this week, and breaks over the weekly upper BB are a rare event. SPX daily chart:
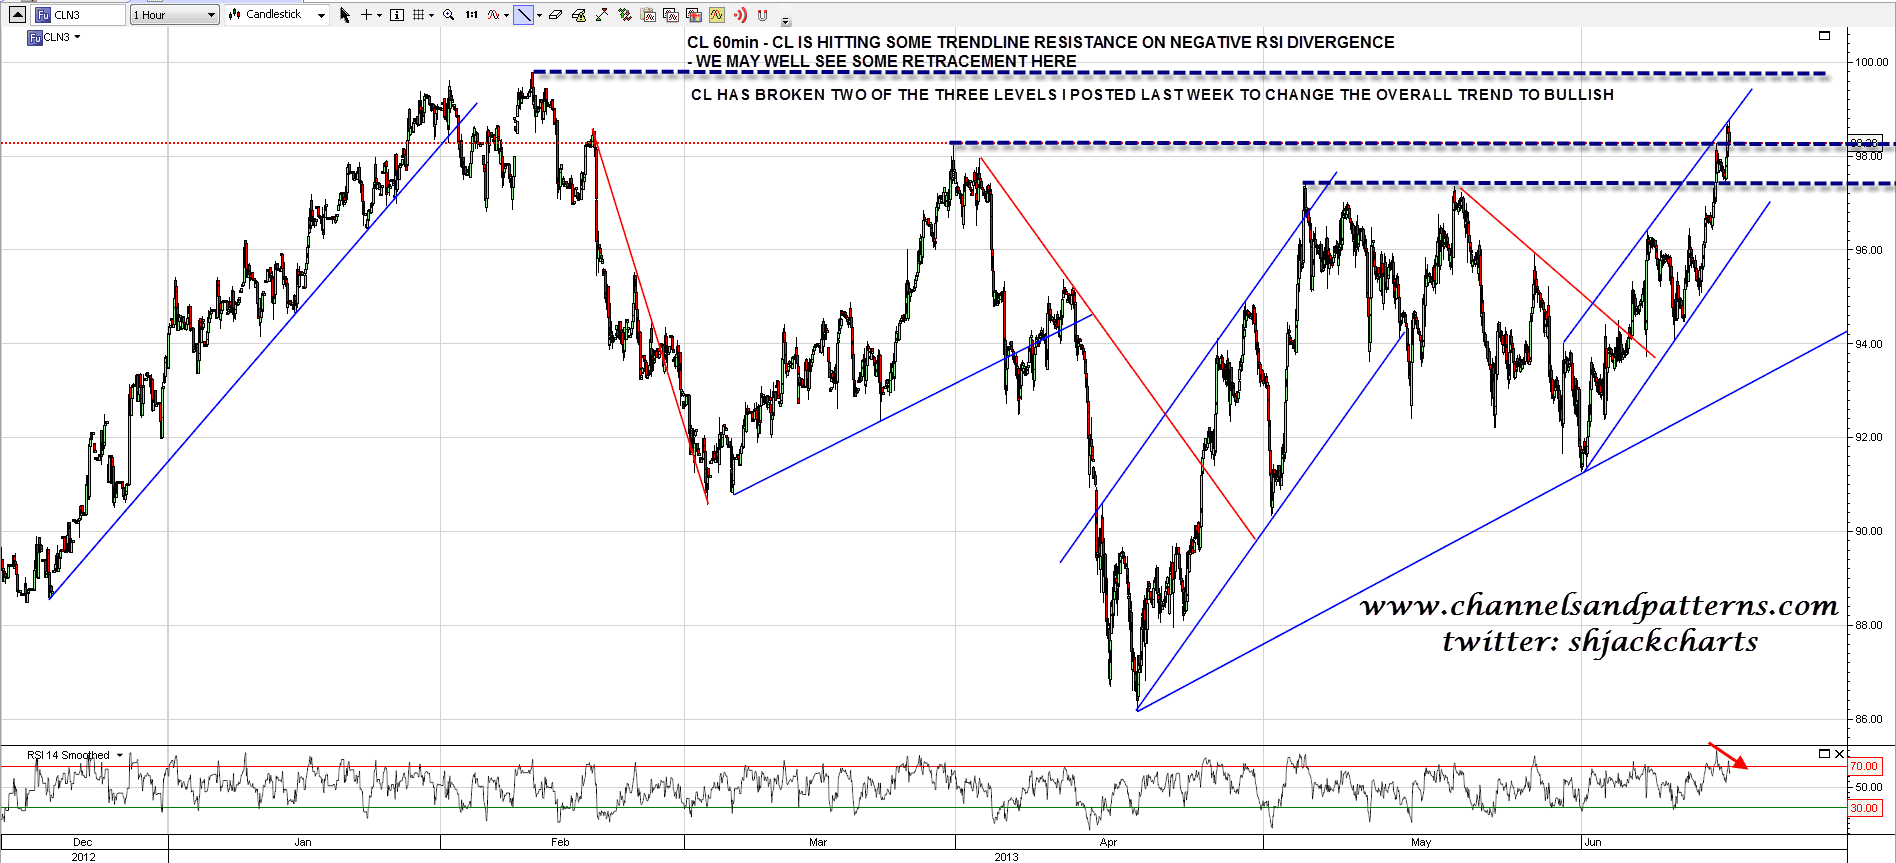
CL has broken over two of the three resistance levels I posted last Thursday and the overall trend is most likely changing to up. Short term the trendline and RSI setup is favoring some retracement here. CL 60min chart:
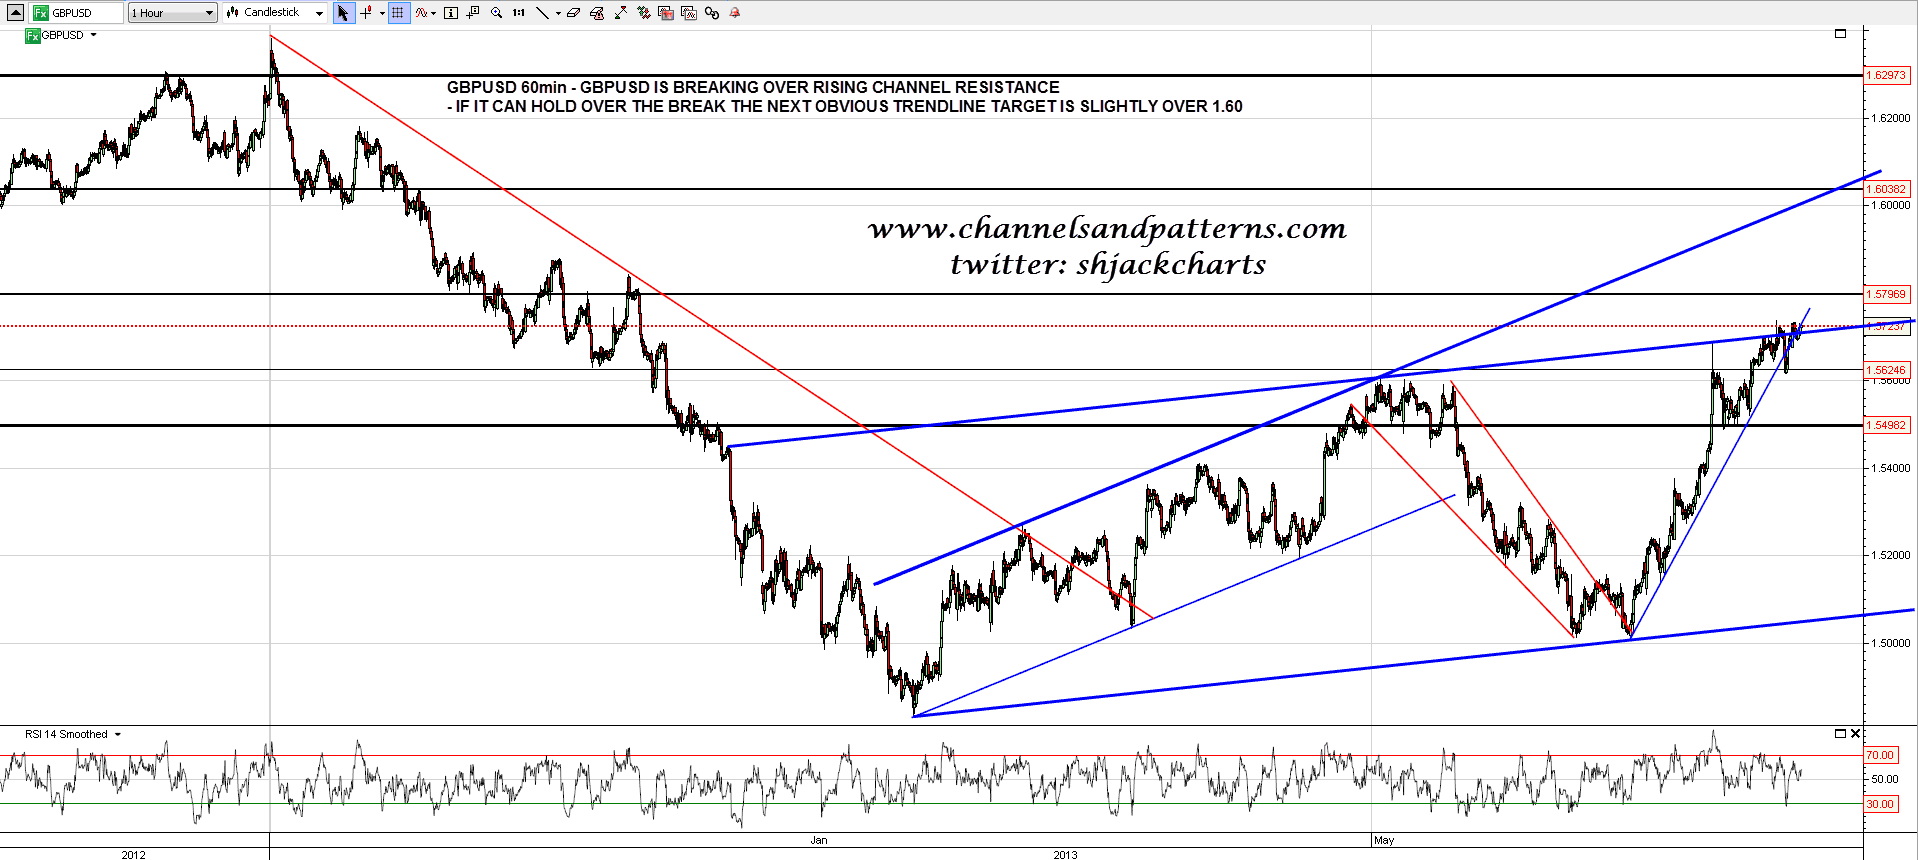
GBPUSD is testing channel resistance and looks as though it will break over it with the next target over 1.60. Until that happens though there is a nice short term double-top setup targeting broken resistance in the 1.55 area, and that level is also a possible H&S neckline. The next move on GBPUSD should be interesting and shed some light on whether the bull move from 2011 on USD is really over. GBPUSD 60min chart:
The most important pattern today is the descending triangle on ES. ES is trading just under the resistance trendline and we should either see a clear break upwards or a break back down towards triangle support today. Support at the ES 50 hour MA is currently in the 1625 area and a clear break below 1617 triggers a short term double-top target in the 1599 area. Triangle support on SPX is in the 1613 area, roughly equivalent to the 1607 ES area.
