
It seems that Ben Bernanke’s term as head at the Fed is coming to an end and that he will most likely be replaced in January 2014. That brought to my mind Isaac Newton’s famous comment that ‘if I have seen further than others it is because I have stood on the shoulders of giants’. In defense of Ben Bernanke’s record at the helm of the Fed, he was standing on the shoulders of his pygmy predecessor Alan Greenspan, and perhaps he would have seemed less of a pygmy himself had he not followed one of the least farsighted and most reckless Fed Chairman in history.
We’ll never know now, but I won’t be celebrating Bernanke’s retirement until we see who will succeed him. Looking at Bloomberg this morning Paul Volcker, Greenspan’s predecessor and perhaps the only past Fed Chairman who would deserve to be described as a giant, does not seem to be on the current shortlist. As Volcker was born in 1927, he is most likely too old now unfortunately.
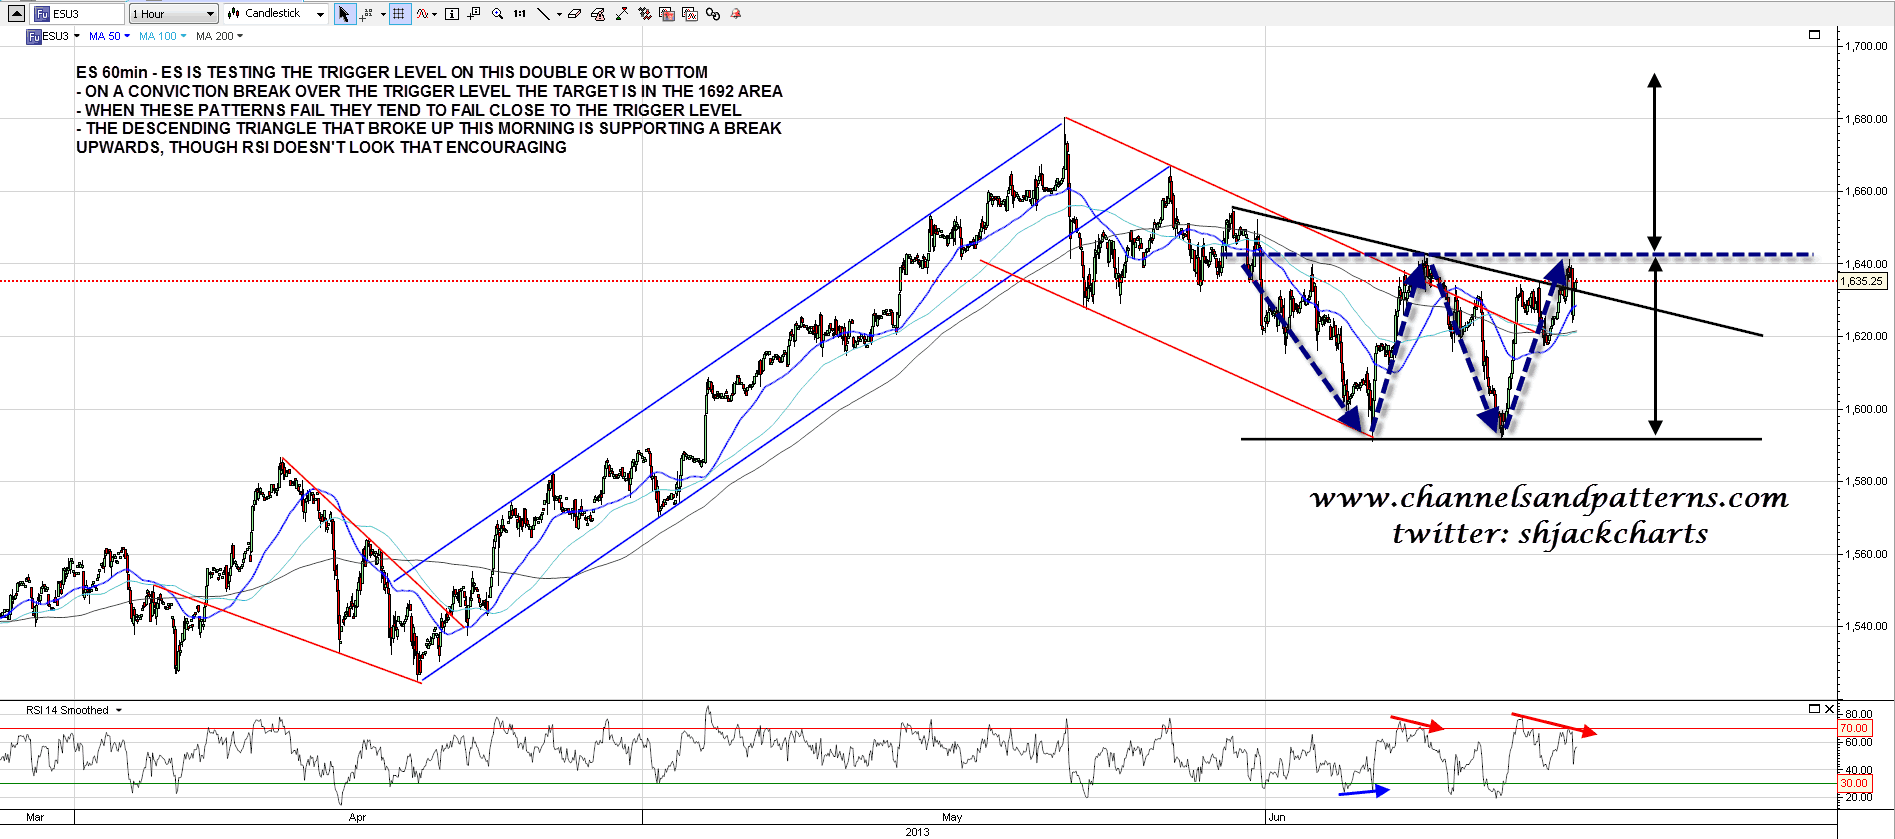
On to the markets. I posted an ES chart on twitter last night showing ES testing the trigger level on the possible double-bottom that I showed last week. The descending triangle that broke up yesterday obviously supports a break upwards, though the 60min RSI looks less encouraging, and I should mention that if ES reverses here back into the current retracement lows, then we would have a very nice looking rectangle bottom formed in June to date. Despite the name these patterns are actually 55% bearish and the target on a break downwards would be broken resistance at the 2000 top. Not much has changed overnight, so the chart below is the one I posted on twitter last night. ES 60min chart:
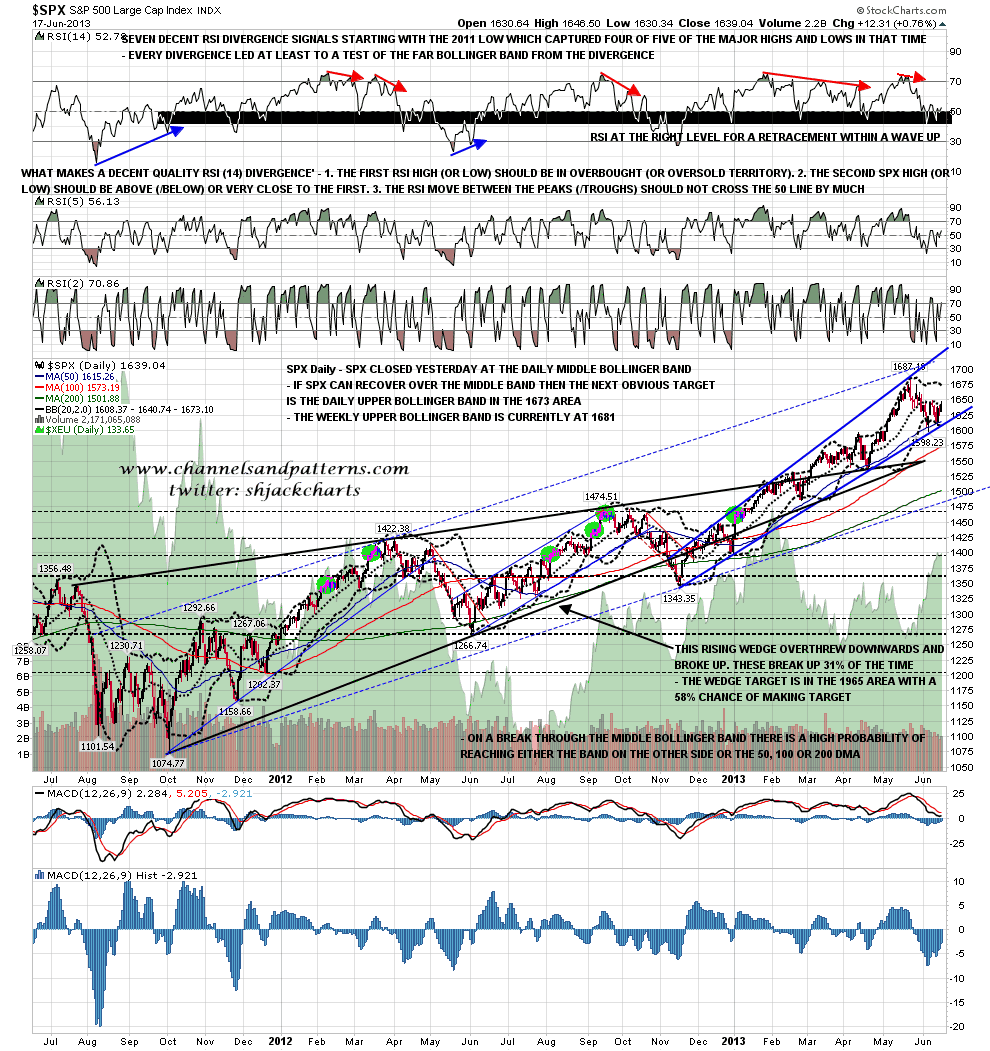
How strong is this resistance level? Pretty strong actually, as it is backed up by resistance at the daily middle bollinger bands which are being tested on multiple equity indices. SPX closed a point under the daily middle bollinger band last night. If we do see a break up the daily upper bollinger band is now at 1673 and the weekly upper bollinger band is currently at 1681. SPX daily chart:
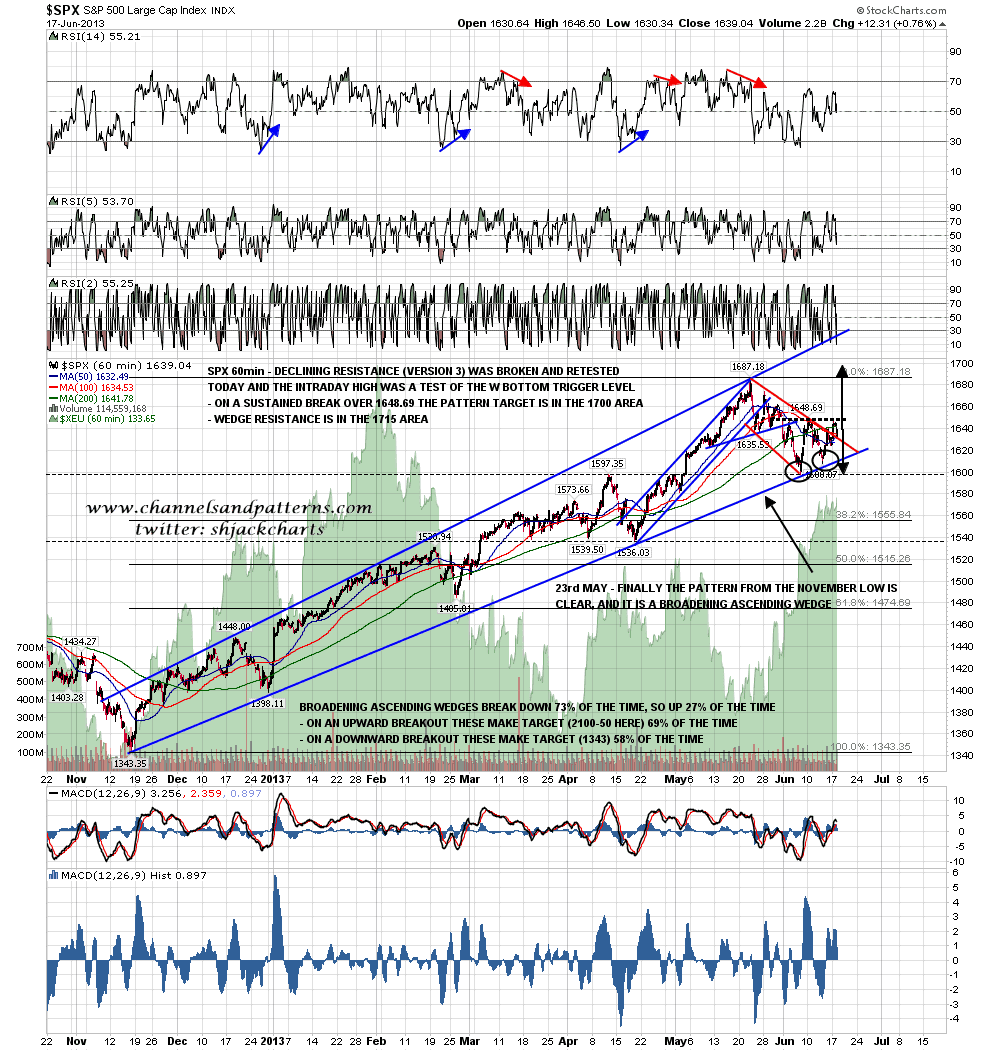
In terms of the broadening ascending wedge since the November low on the SPX 60min chart, if we are to see a return to the wedge resistance trendline, that’s a fairly good fit with these double bottoms, as the SPX target is in the 1700 area, and wedge resistance is currently in the 1720 area. SPX 60min chart:
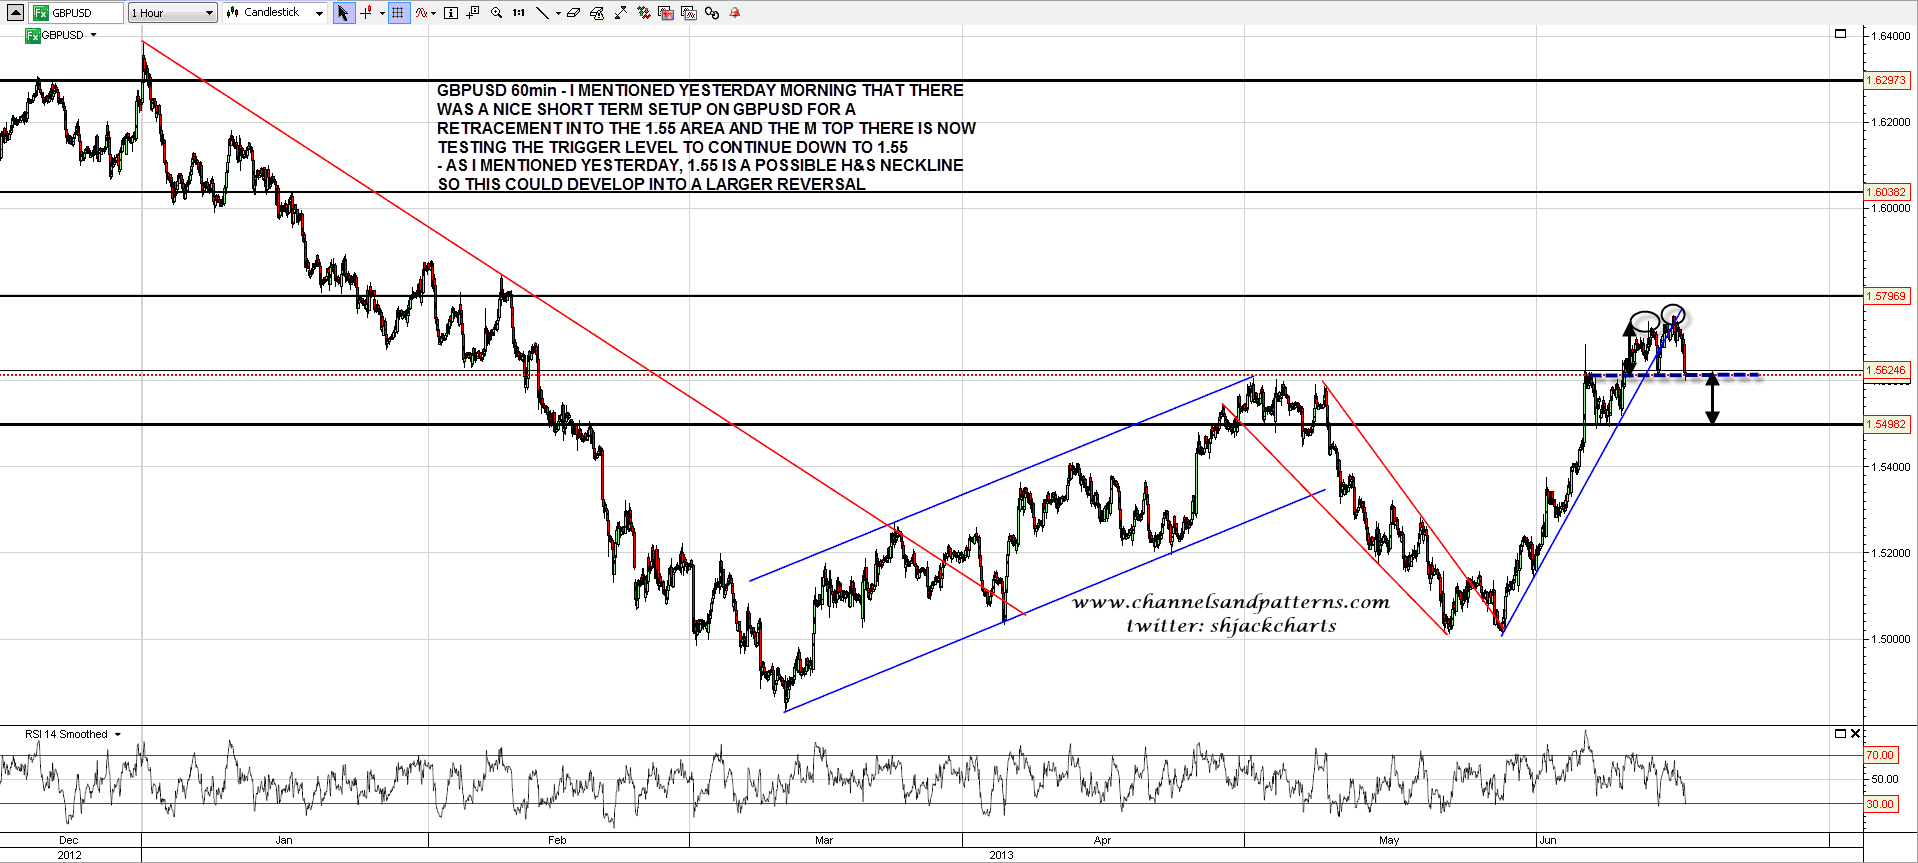
On other markets I pointed out yesterday morning the setup for a retracement into the 1.55 area on GBPUSD, and that’s now fallen to test the M top trigger level that would trigger that 1.55 area target. As I mentioned yesterday, 1.55 is a possible H&S neckline, so a retracement to 1.55 (followed by a right shoulder bounce) could develop into a larger retracement. GBPUSD 60min chart:
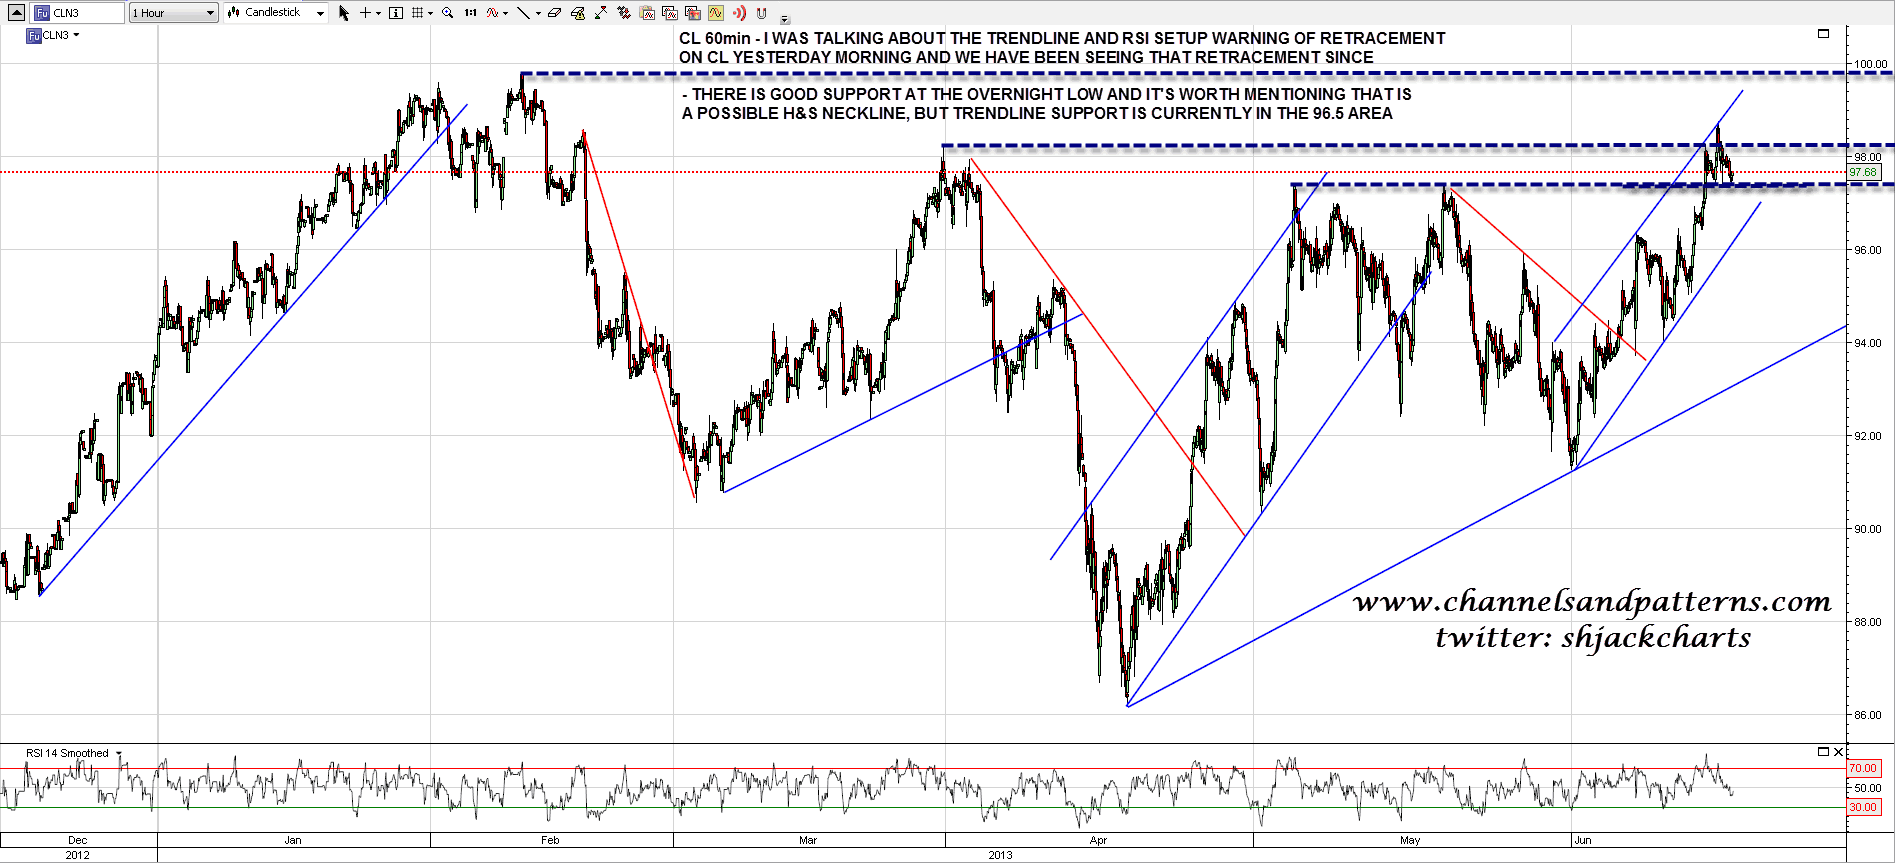
I mentioned yesterday morning that the trendline setup on CL favored retracement and we have been seeing retracement since then. There is another M top on CL and the trigger level there is also being tested. On a break downwards the obvious target is at trendline support in the 96.5 area:
I’m neutral on the market today. Significant resistance is being tested and on a conviction break up the short term outlook would switch to strongly bullish, with the caveat that when double-bottoms fail, they tend to fail shortly after breaking the trigger level and not far above it. My preferred scenario here would be a reversal back to test the current lows and then below, to deliver a more significant retracement from the high than we have seen so far.
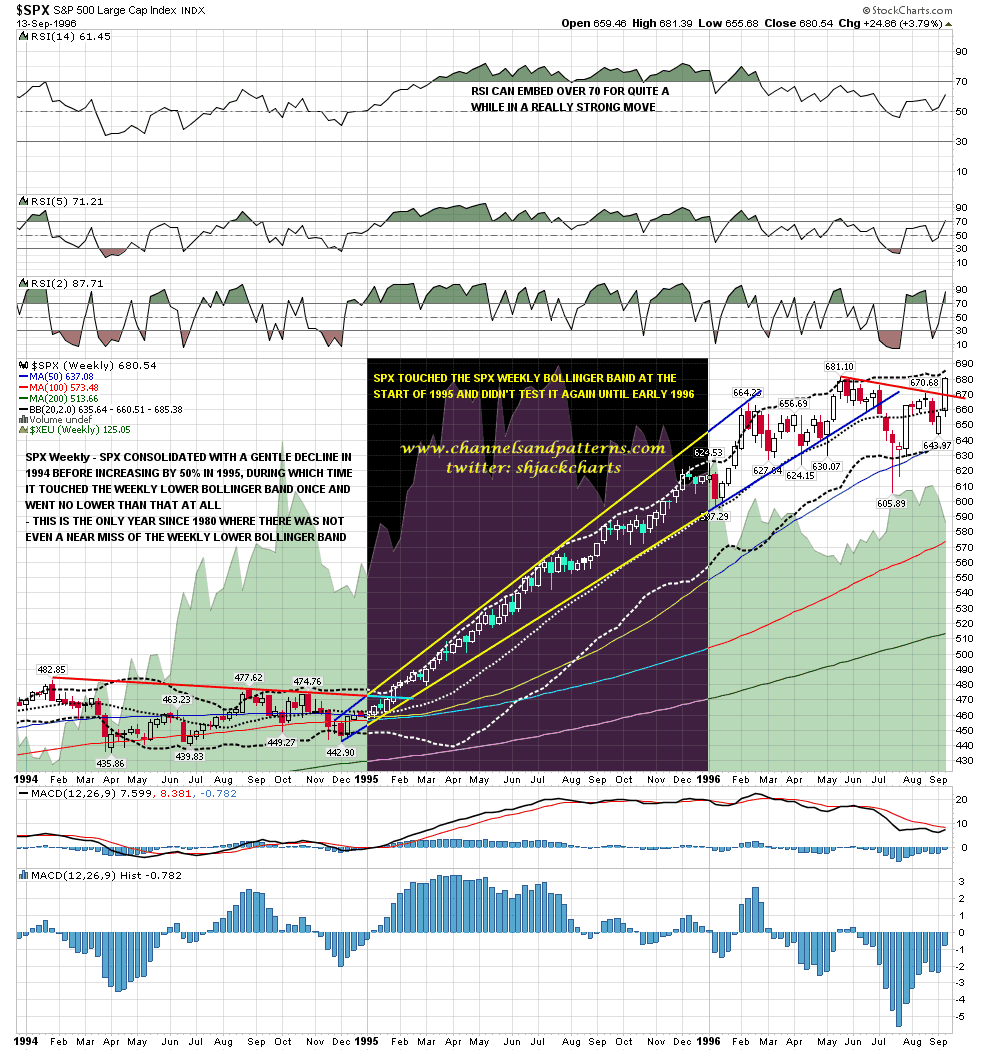
Why would I like to see that deeper retracement? Mainly to deliver a better buying opportunity for the next move up, but also to break the broadening wedge on SPX, as I am concerned that this may be the only significant retracement this year, and I am concerned that we could be looking at a repeat of 1995 here if we don’t see a deeper retracement now. You may recall that I mentioned a few days ago that 1995 was the only year since 1980 when at least a near miss of the weekly lower bollinger band (currently at 1487) was not seen and where the low for the year was at the weekly middle bollinger band (currently at 1585). The weekly chart with bollinger bands for 1994 through 1996 is below and is worth a look. SPX weekly chart 1994-6:
I’ve been looking at the possible analog from the 2009 low with the thirteen years from the 1987 low to the 2000 high, and will be doing a weekend post this weekend on the similarities so far between the 1987-1995 and 2009-2013 periods. This will be the second post in my Brave New World Series, and for anyone who missed the first of those last weekend looking at past secular bear market cycles, you can see that here.
