
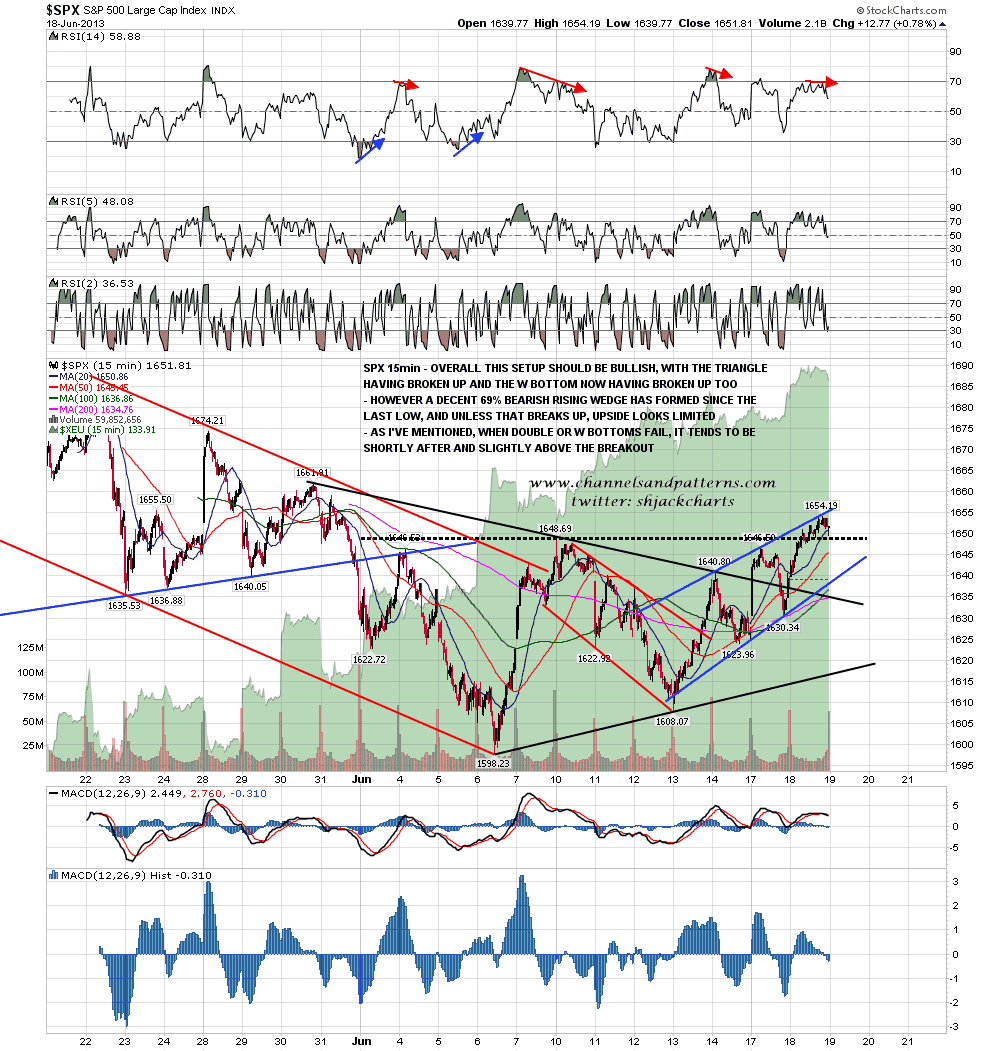
The chart I posted on twitter after the close yesterday showed the 69% bearish rising wedge that has formed from the last low on the SPX 15min. The W bottom broke up yesterday and is now at the usual point where these patterns can fail, which is just above the breakout level. If this bullish setup forming over the last few days is going to fail, this is the most likely place. If the rising wedge breaks up today, we will then have a triangle, W bottom and rising wedge pointing back above the current highs. At the least I would then expect to see a hit of the SPX daily upper bollinger band in the 1672 area and most likely a retest of the highs. SPX 15min chart:
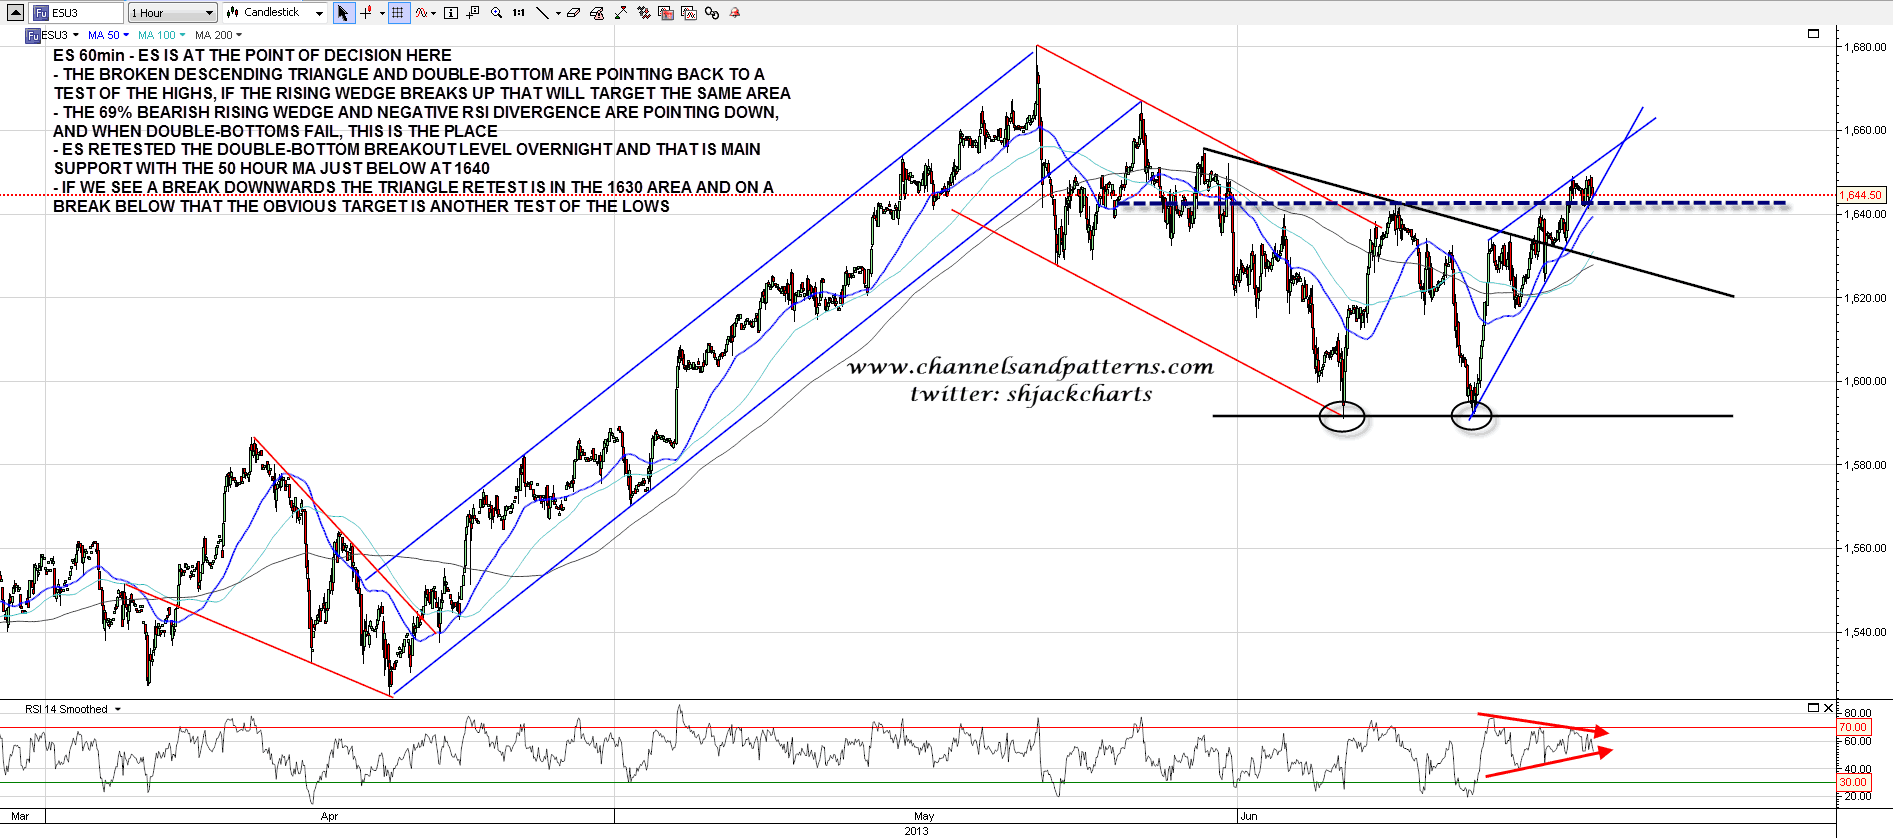
All three patterns are also visible on the ES chart, with the double-bottom there being stronger and clearer negative divergence on the 60min RSI. The double-bottom breakout was retested overnight and held, that is main support today with secondary support at the 50 hour MA in the 1640 area, and some support below at the triangle breakout level in the 1630 area. If we see 1630 break with any confidence I’ll be looking for a test of the June lows. ES 60min chart:
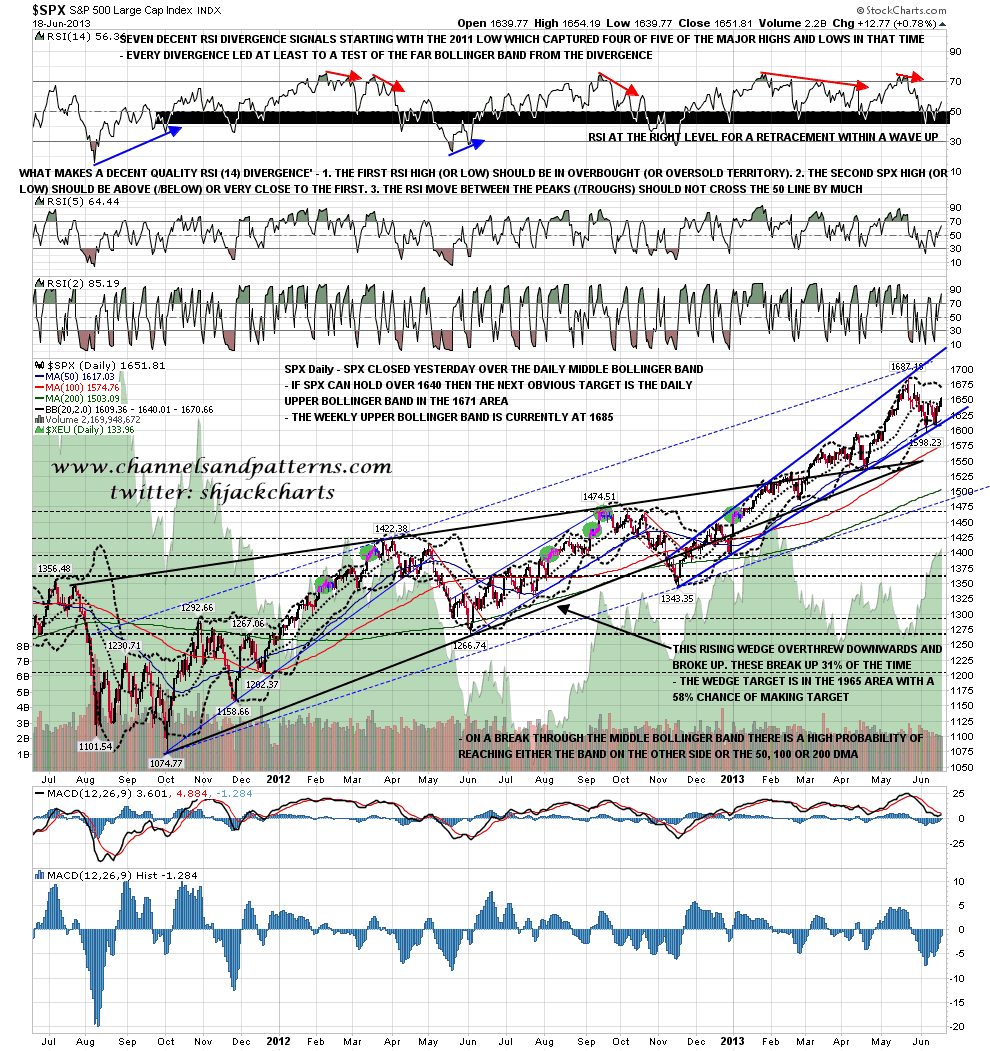
On the SPX daily chart the close yesterday was six points above the daily middle bollinger band at 1640, and if that holds today the next obvious target is the daily upper bollinger band at 1671. The weekly upper bollinger band is now at 1685. SPX daily chart:
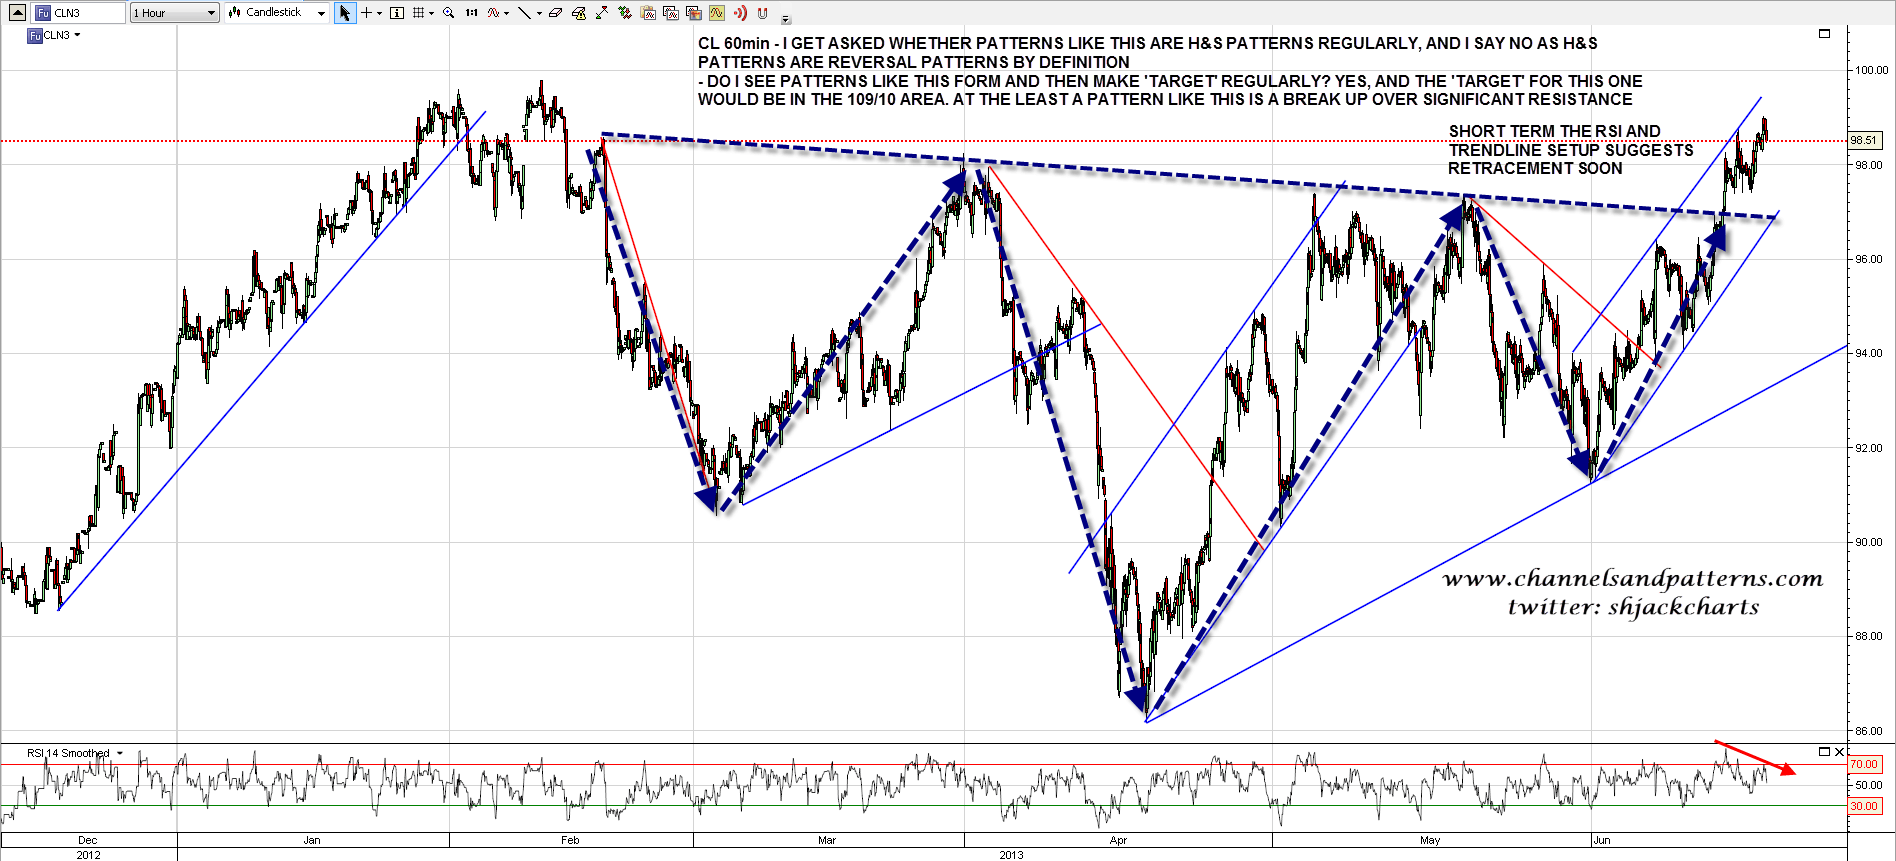
On other markets I wanted to talk about the apparent downsloping IHS on CL today. I get asked about patterns like this a lot, and I always reply that H&S patterns are reversal patterns by definition, so a pattern like this cannot be an H&S or IHS. That said I see these form and play out to ‘target’ pretty regularly so this ersatz IHS is worth bearing in mind and the ‘target’ would be in the 109/10 area. At the least CL has broken over a significant resistance trendline. Short term the trendline and RSI setup favor some retracement soon. CL 60min chart:
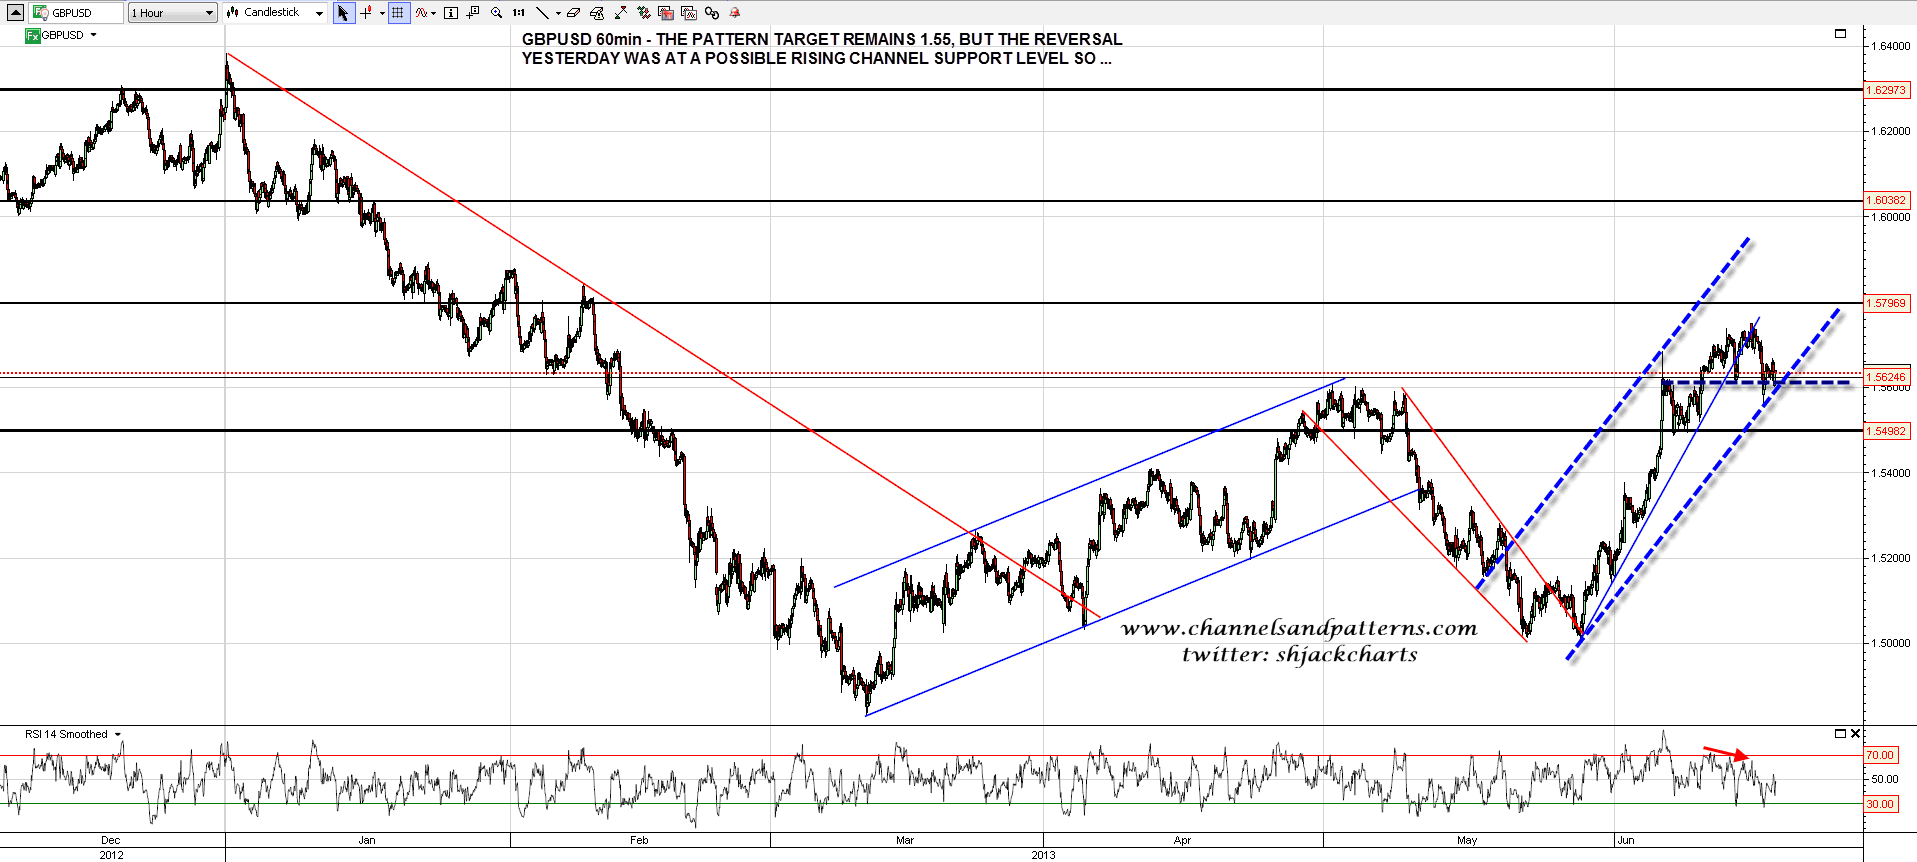
The target on GBPUSD is still the M top target at 1.55, but I would note that the low yesterday was at possible rising channel support. GBPUSD 60min chart:
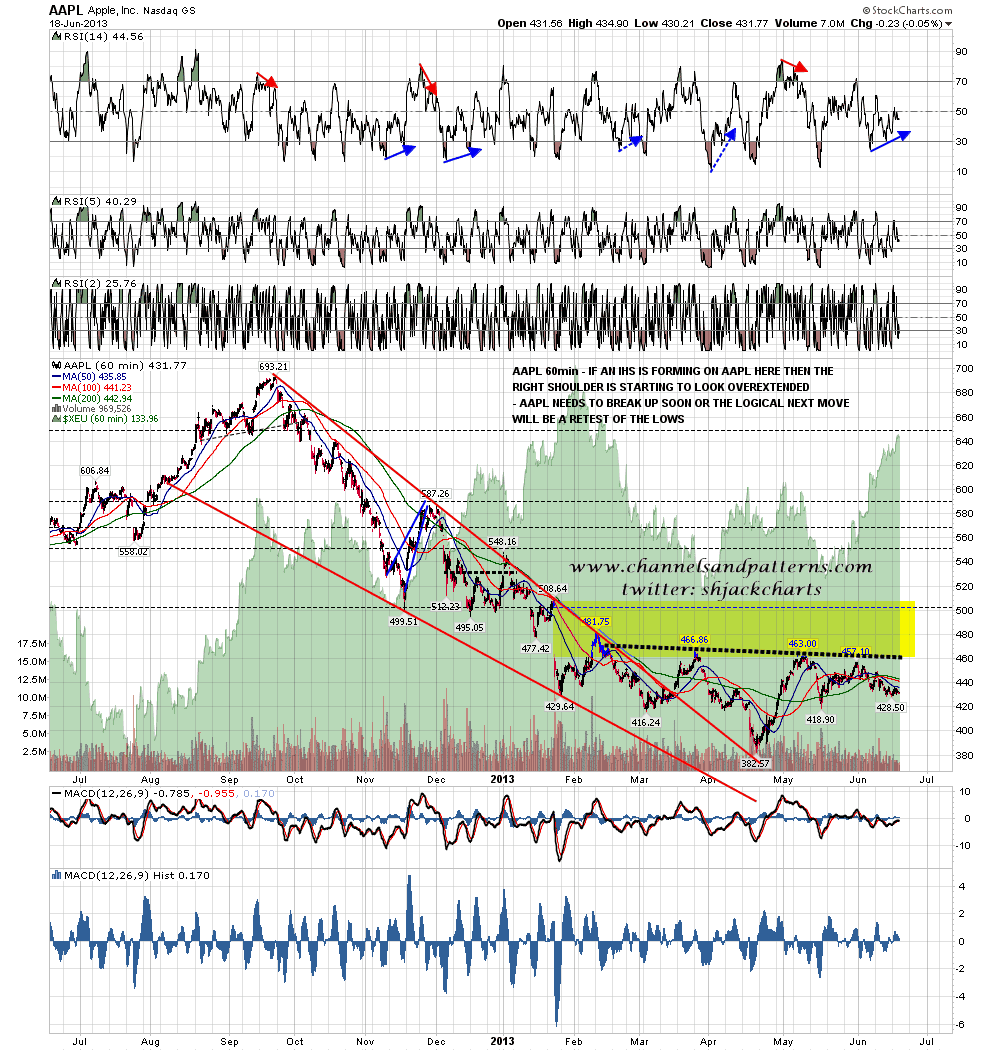
I haven’t posted an AAPL chart in a few days as nothing of great interest has been happening. The right shoulder on the possible IHS forming there is becoming overextended and AAPL needs to complete the pattern soon if it is going to finish forming. If it doesn’t finish forming I’d expect a test of the current lows. AAPL 60min chart:
The main pattern to watch today is the rising wedge on SPX and ES, which should soon either break up or down. As with any triangle an overthrow or false break is possible before this picks a firm direction. I am leaning slightly bearish overall and will lean more strongly bearish on a clear break below 1640 ES. On a push up over 1655 ES I’ll be expecting an attempt at the highs. I’m expecting to see either a test of the May high or June low in the next few days, and if we see new highs made on SPX then the obvious next target will be broadening wedge resistance in the 1720 area, along with other longer term resistance trendlines in the same area:
