
SPX broke below support yesterday and went on to close well below the daily lower bollinger band. SPX also came within four points of testing the 50 DMA, which I would consider a technical hit. SPX hasn’t yet reached my downside target, and I don’t think this correction is over, but I’m definitely looking at bounce options here. SPX daily chart:
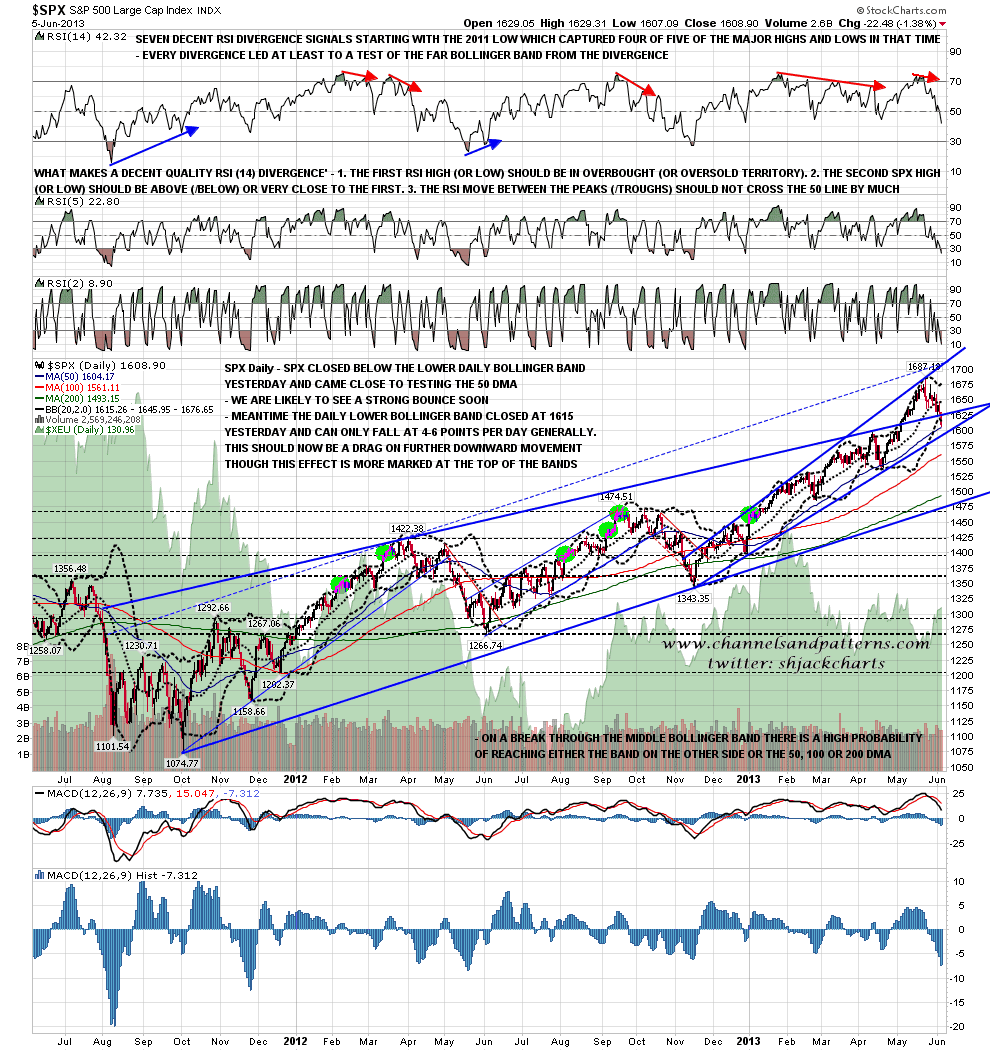
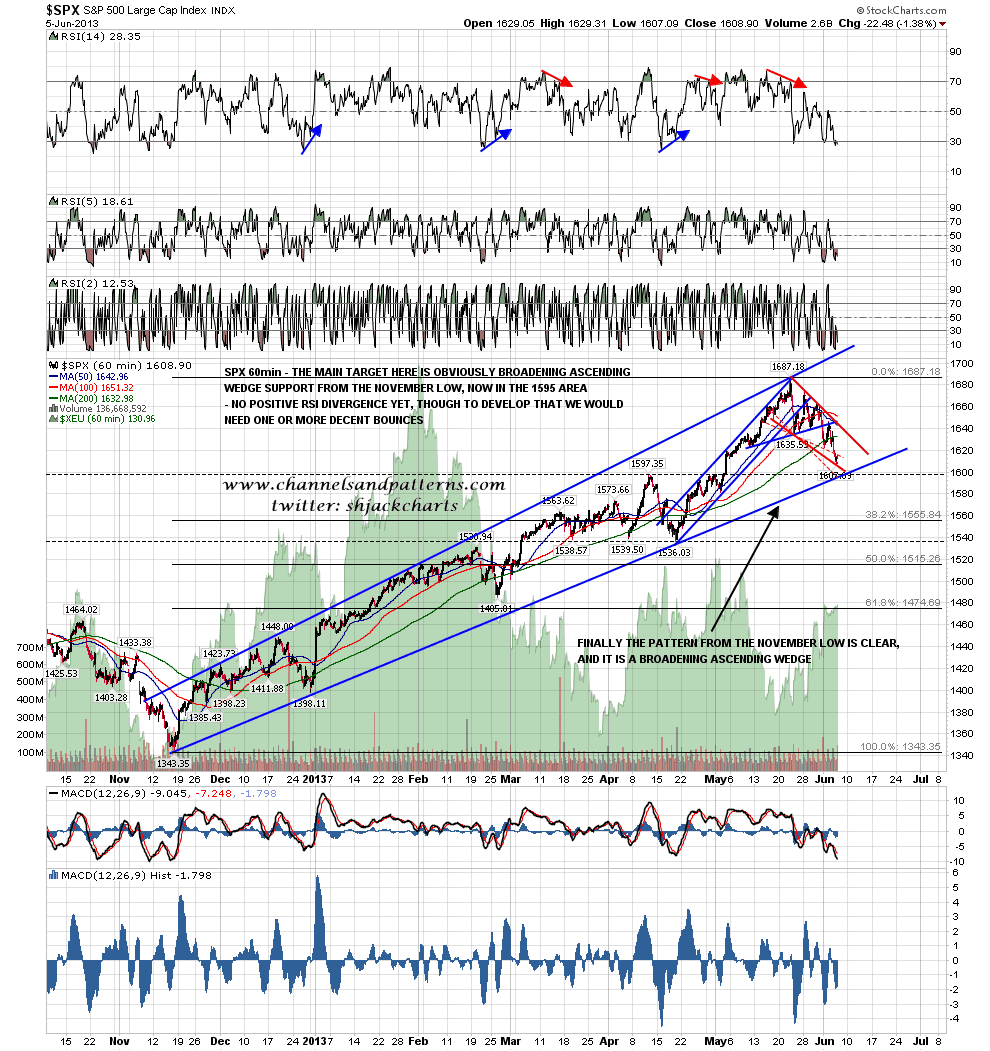
The primary target since my post on 23rd May identifying the broadening ascending wedge on SPX has been the wedge support trendline, and I now have that in the 1595-7 area. If we see some continuation down today then that is the obvious target and long entry level for a bounce. However we may well see a decent bounce before that target is reached, not least to establish the positive 60min RSI divergence that may well have developed by the time that target is hit. SPX 60min chart:
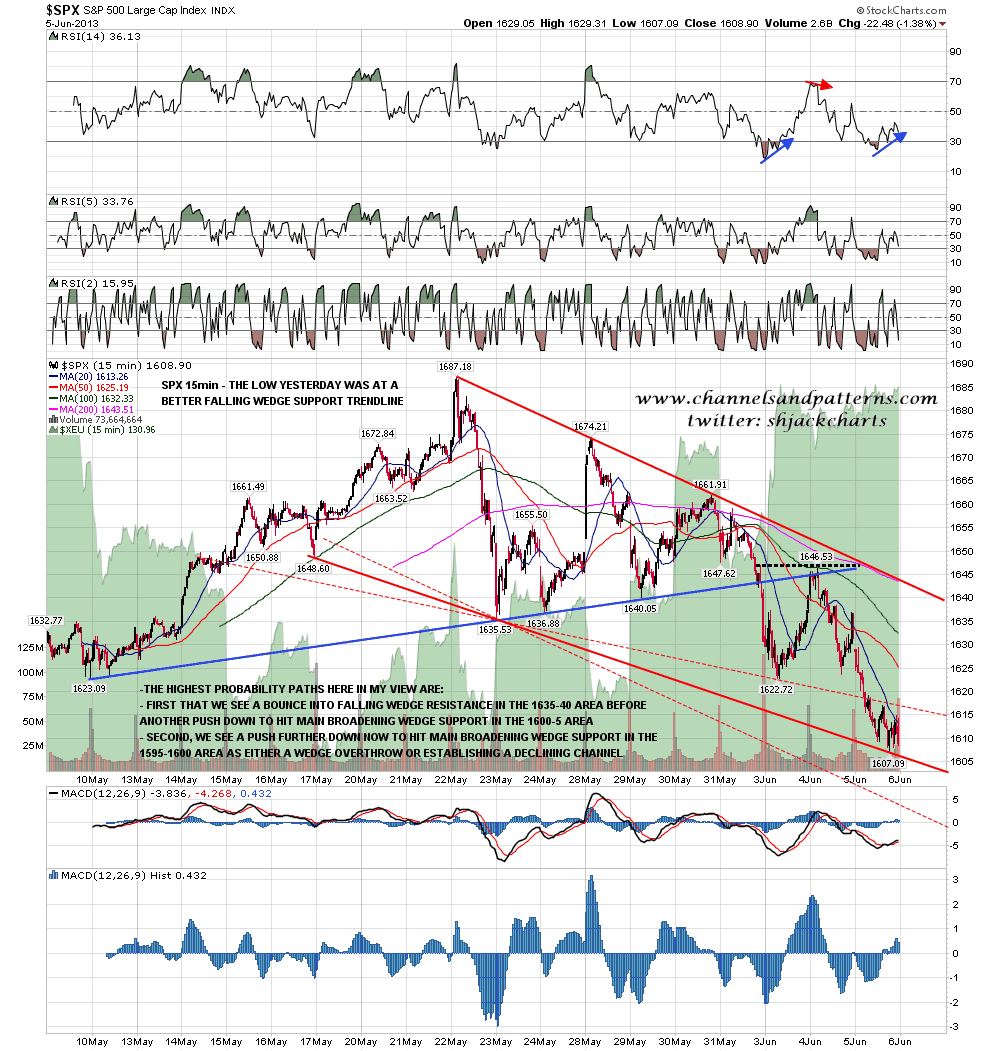
How might that bounce develop? Well I had drawn in a possible falling wedge support trendline on the SPX 15min chart yesterday and what’s worth noting from that chart today is that the low yesterday was at a better option for a falling wedge trendline, and that is a real contender for wedge support. If that holds today then I’d be looking for a bounce into falling wedge resistance, most likely in the 1635-40 area tomorrow, and then another decline to hit main broadening wedge support, most likely by then in the 1600-5 area. Alternatively SPX might just decline to hit that target today obviously. SPX 15min chart:
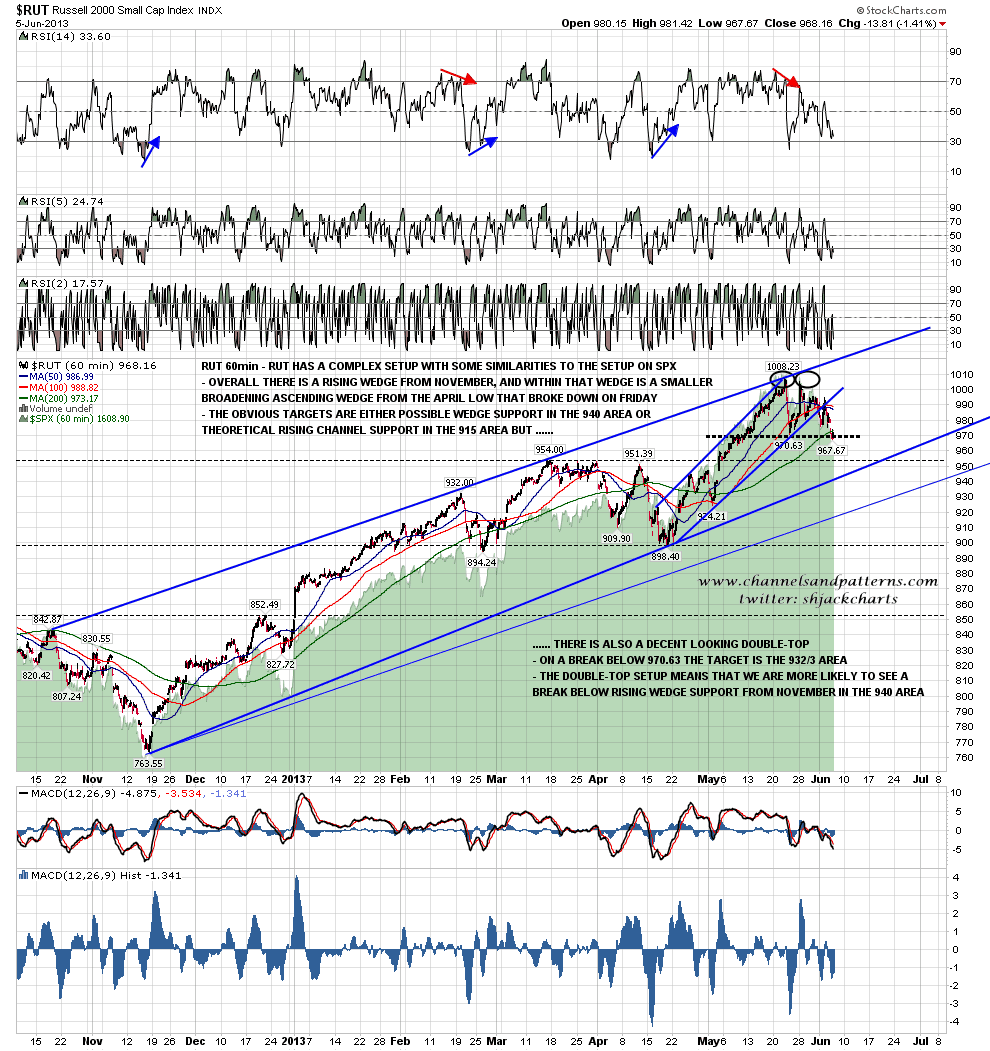
What are the patterns on other equity indices telling us here? The setup on RUT looks most similar to SPX, though there is also a double-top formed there which is testing the pattern trigger level. Where these patterns fail, it tends to be right where RUT is right now, so the possibility of a strong bounce here is wide open on RUT, though the chances are that we would see more downside after that. RUT 60min chart:
The double-top on Dow has broken down with a target in the 14820 area. that’s a good fit with the SPX wedge support trendline and at this stage of the double-top I’d expect it to make the target area. Nothing to exclude a decent bounce here to retest the break though. Dow 60min chart:

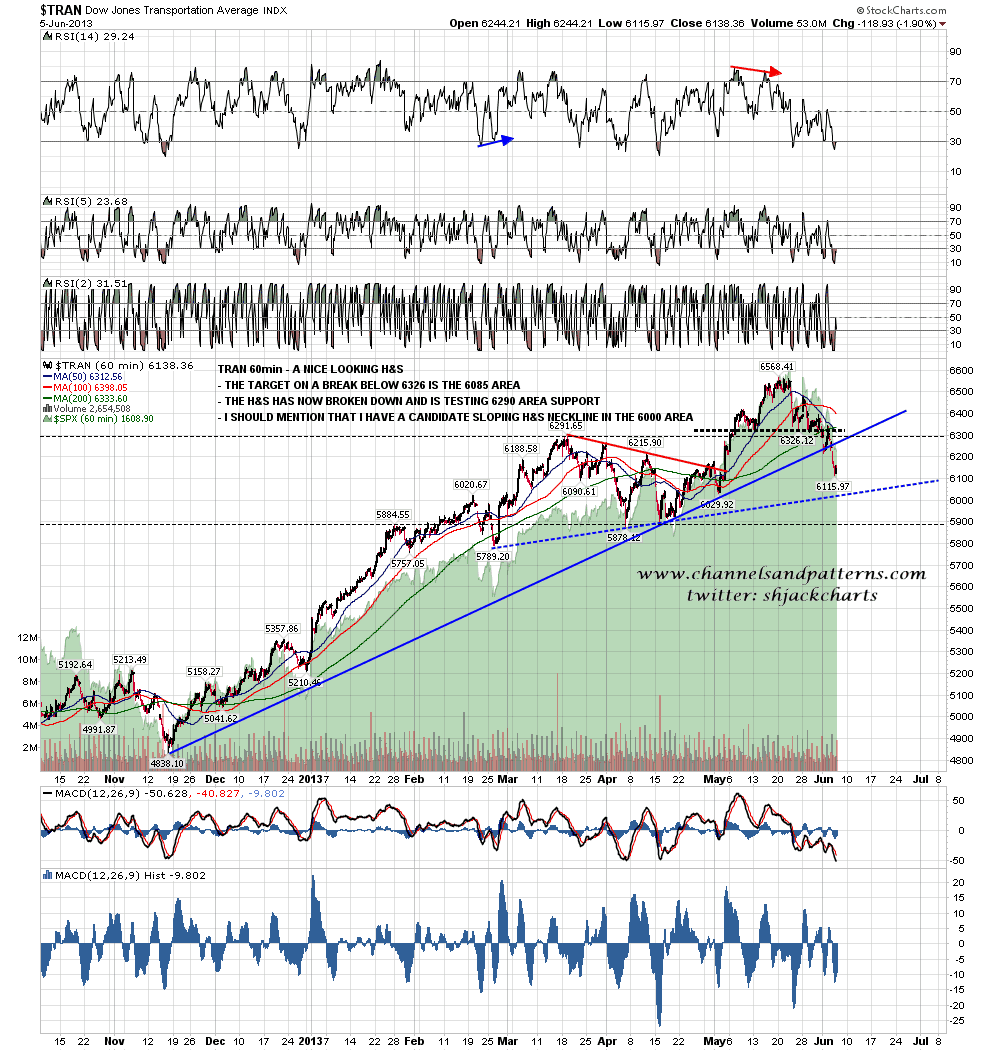
On TRAN the H&S broke down and has almost made the 6085 area target, I also have a possible trendline target in the 6020-30 area. Again the low most likely isn’t in yet but there’s nothing to exclude a bounce here:
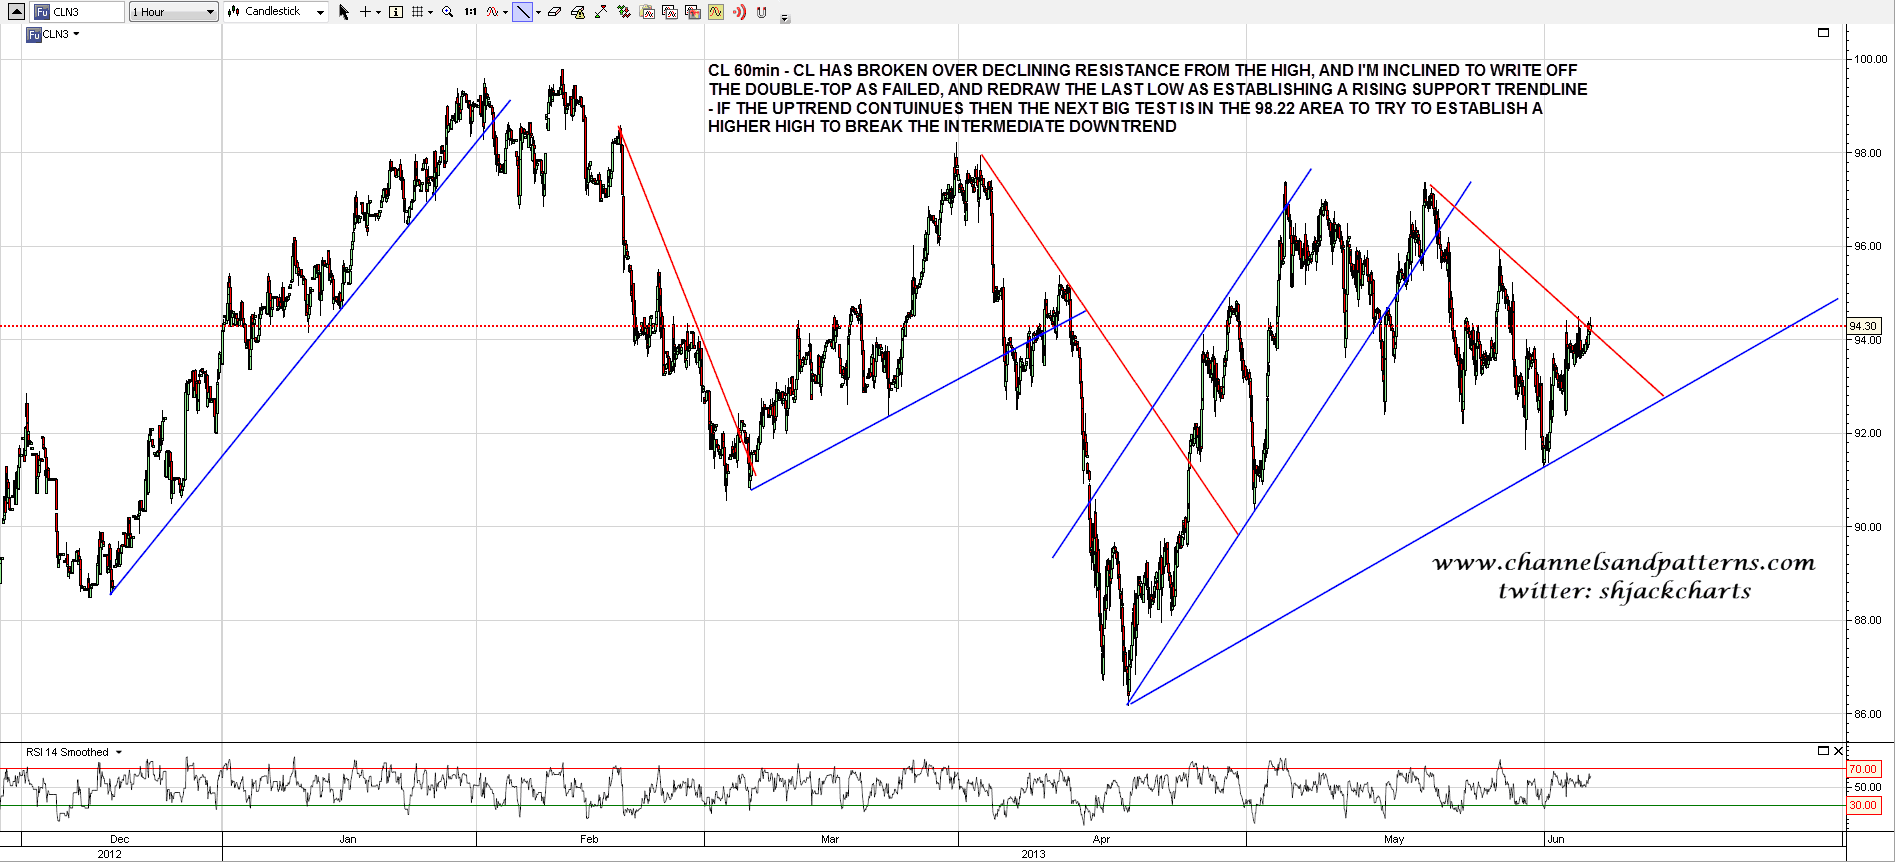
CL has broken declining resistance overnight so I’m treating the double-top setup as failed and switching my bias to cautiously bullish. I’ve drawn in a revised uptrend support trendline and if the uptrend continues the next big target is to get through the 98.22 area to establish a higher high to break the intermediate term downtrend. CL 60min chart:
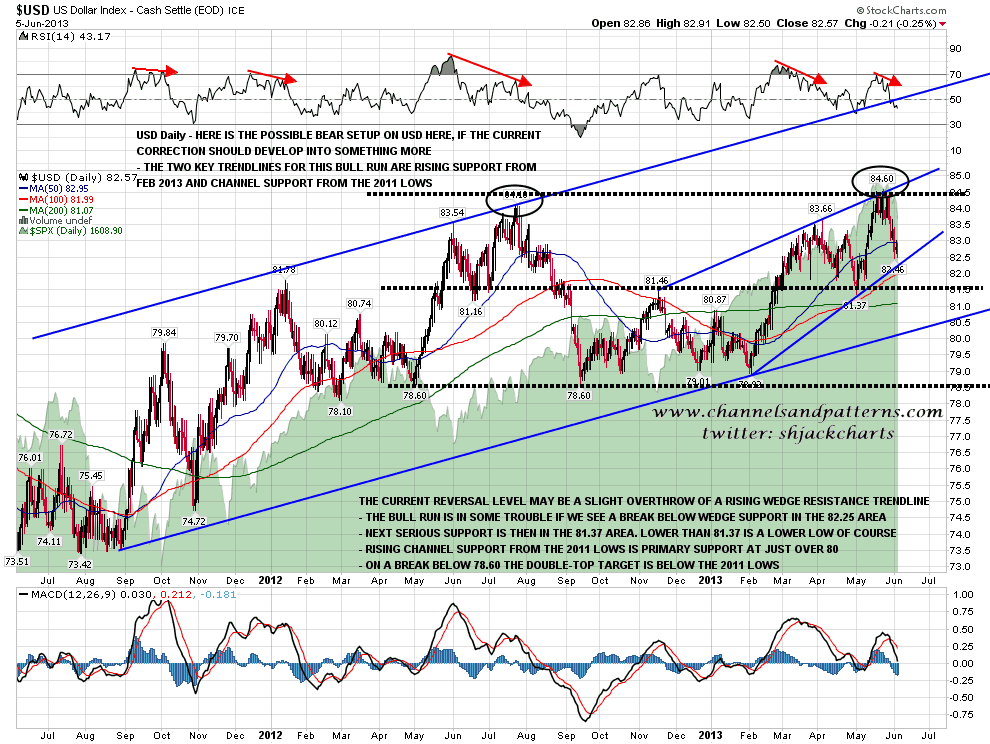
USD is testing rising support from February. If that breaks then there is strong support in the 81.37 area. A break below 81.37 would establish a lower low of course. I have sketched out a possible very bearish scenario for USD on this chart but that’s just assessing options. My baseline scenario is that both USD and SPX are retracing here within strong overall uptrends. USD daily chart:
I don’t think that the low is in and we could see a move today to make it to the targets on SPX, Dow and TRAN. Regardless of that however, a strong bounce soon is likely and I’ll be looking for good long entries for that.
