
I have a working hypothesis for the next year or so on equities. The high so far this year shows no signals of a bull market high, so I’m looking for a summer retracement to test the SPX 200 DMA, currently at 1504 (and rising obviously), and attempt a test of the SPX weekly lower bollinger band over 1500, currently at 1488 and rising. SPX would then make a tradeable low and the next move into the 2014 spring/summer high would begin. I have more to say on downside targets on a break below the current June lows, but I’ll talk about those another day.
To see a decent tradeable low however, the current broadening ascending wedge on SPX needs to break downwards. The technical target at the November low is of no practical importance, but the wedge cannot realistically last into next year, and historically is unlikely to break upwards. Now that the bullish setup into FOMC yesterday has failed I’m looking for a retest of wedge support, now in the 1615 area, and if my scenario for the next year is right, that should soon be broken.
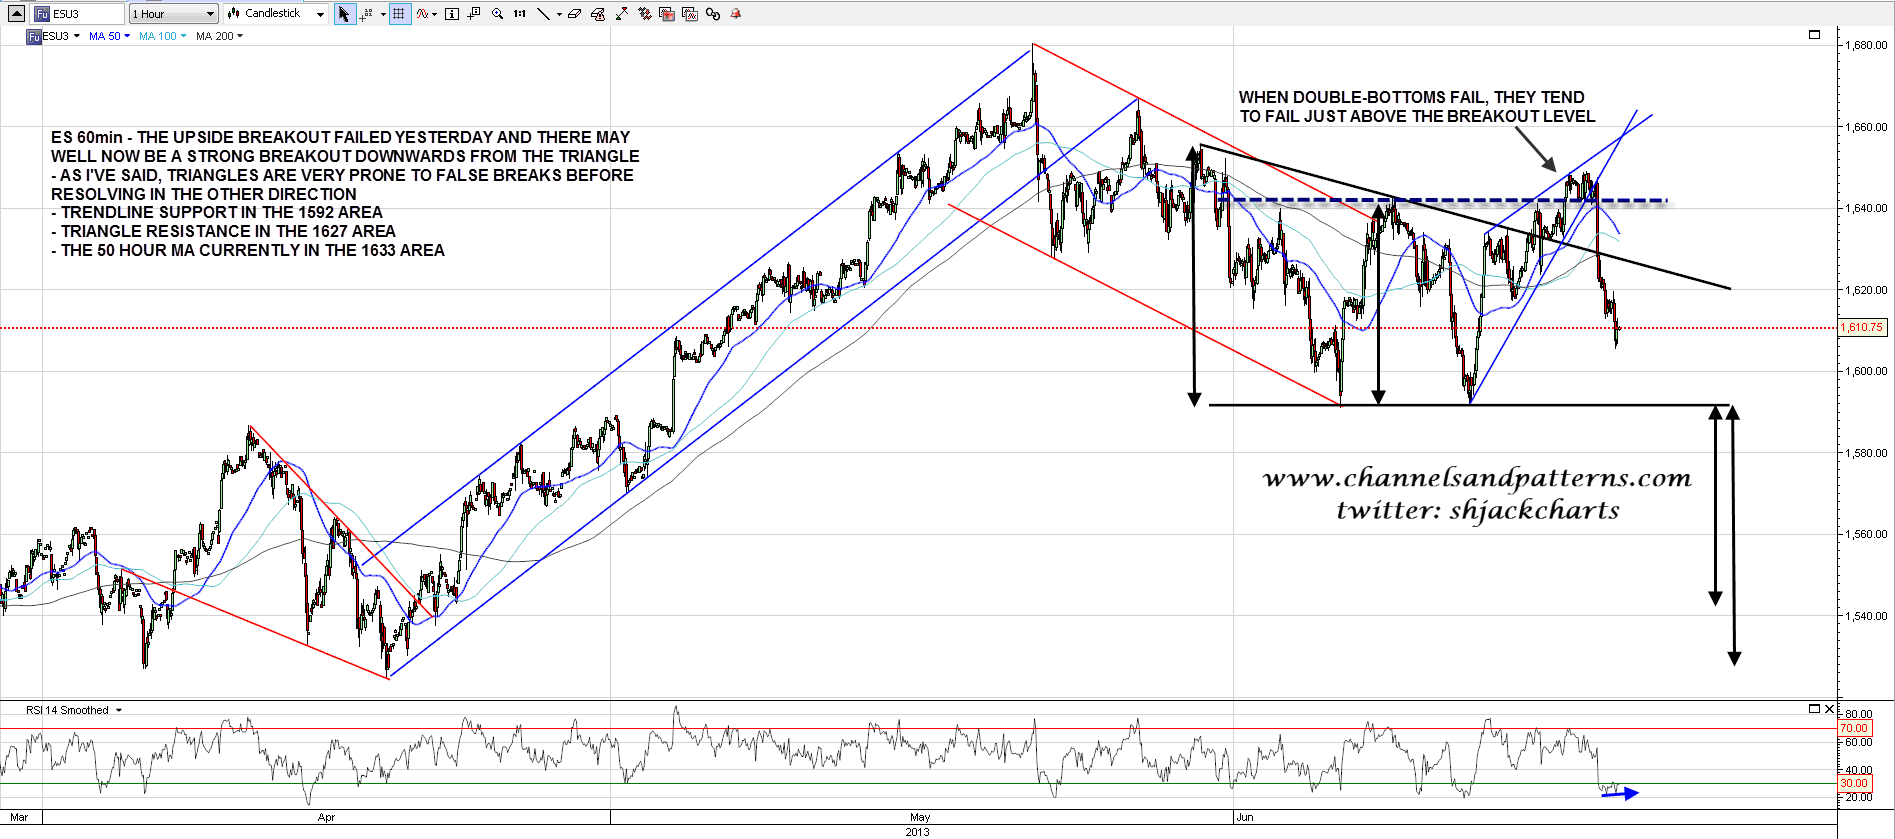
Looking at ES, the pattern setup here is still the descending triangle that broke up a few days ago. I’ve mentioned often that triangles are very prone to false breaks in one direction before resolving in the other, and that’s what I’m looking for here. On ES the next test is of triangle support in the 1592 area, and on a break below there the pattern target would either be the 1542 area (conservative) or the 1525 area (full target). ES 60min chart:
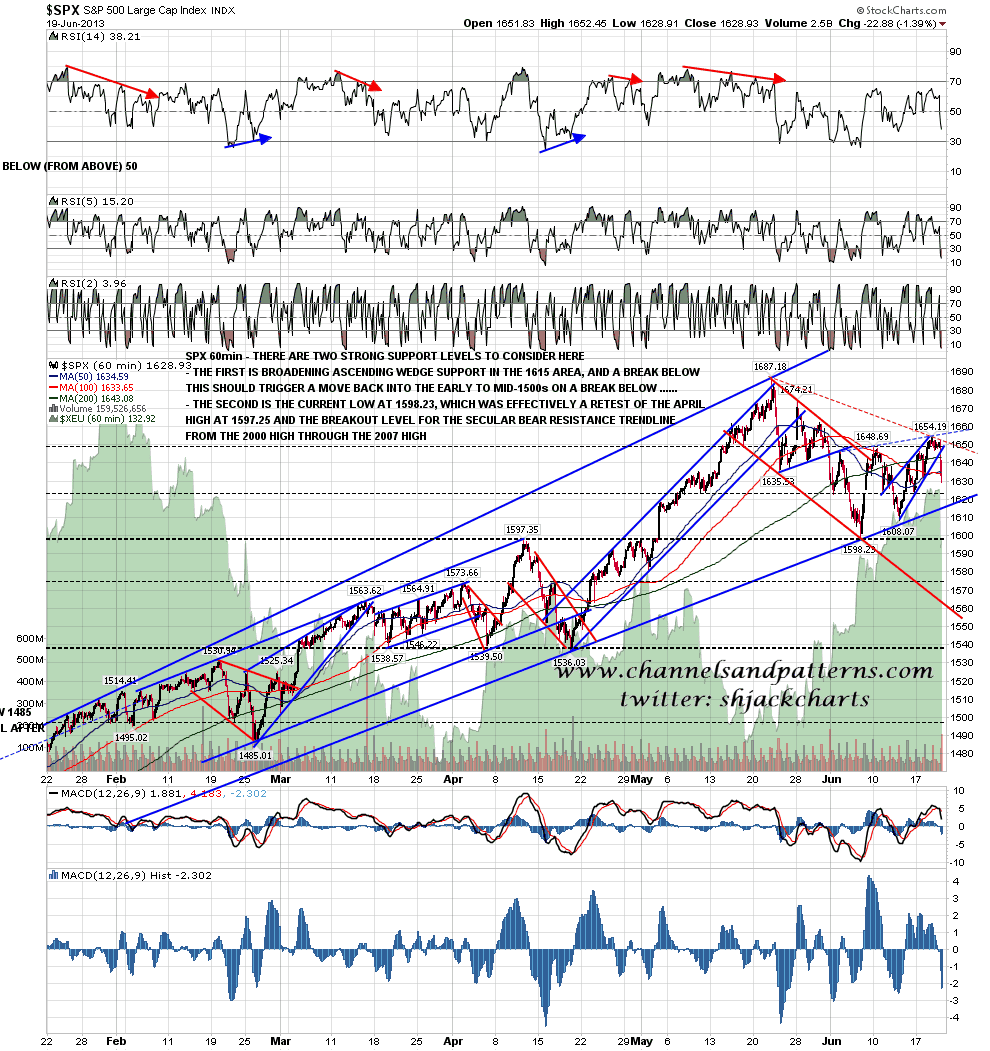
On the SPX 60min chart main broadening ascending wedge support is now in the 1615 area and a break below there should signal a retracement well below 1600. However the June low at 1598.23 is still in a very significant support area, as it was effectively a test of the April high at 1597.35, and that level is the breakout level for the major resistance trendline from the 2000 high through the 2007 high. That’s very strong support, and I’m expecting it to break, but until it does it’s still very strong support. SPX 60min chart:
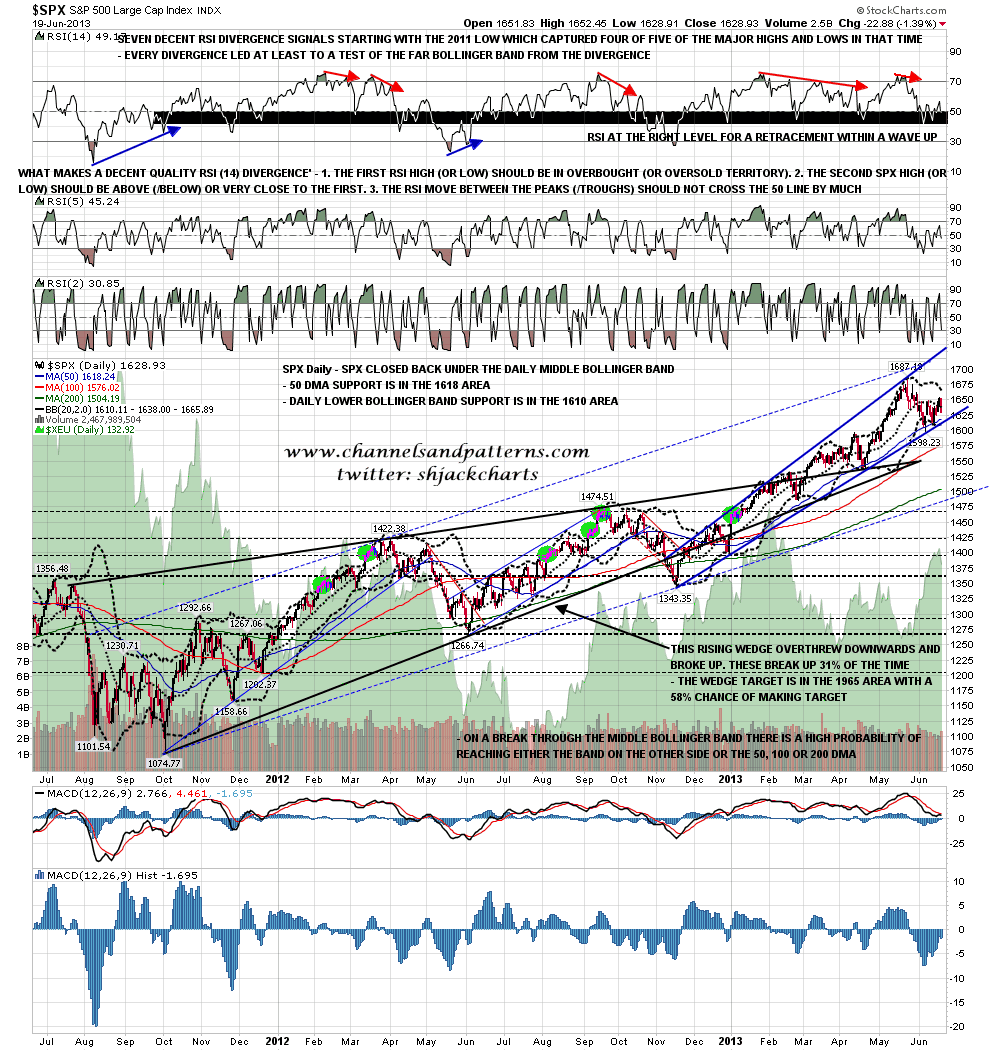
On the SPX daily chart we obviously saw a strong break back below the middle bollinger band yesterday. The key support levels for today are the 50 DMA at 1618 and the lower bollinger band at 1610. SPX daily chart:
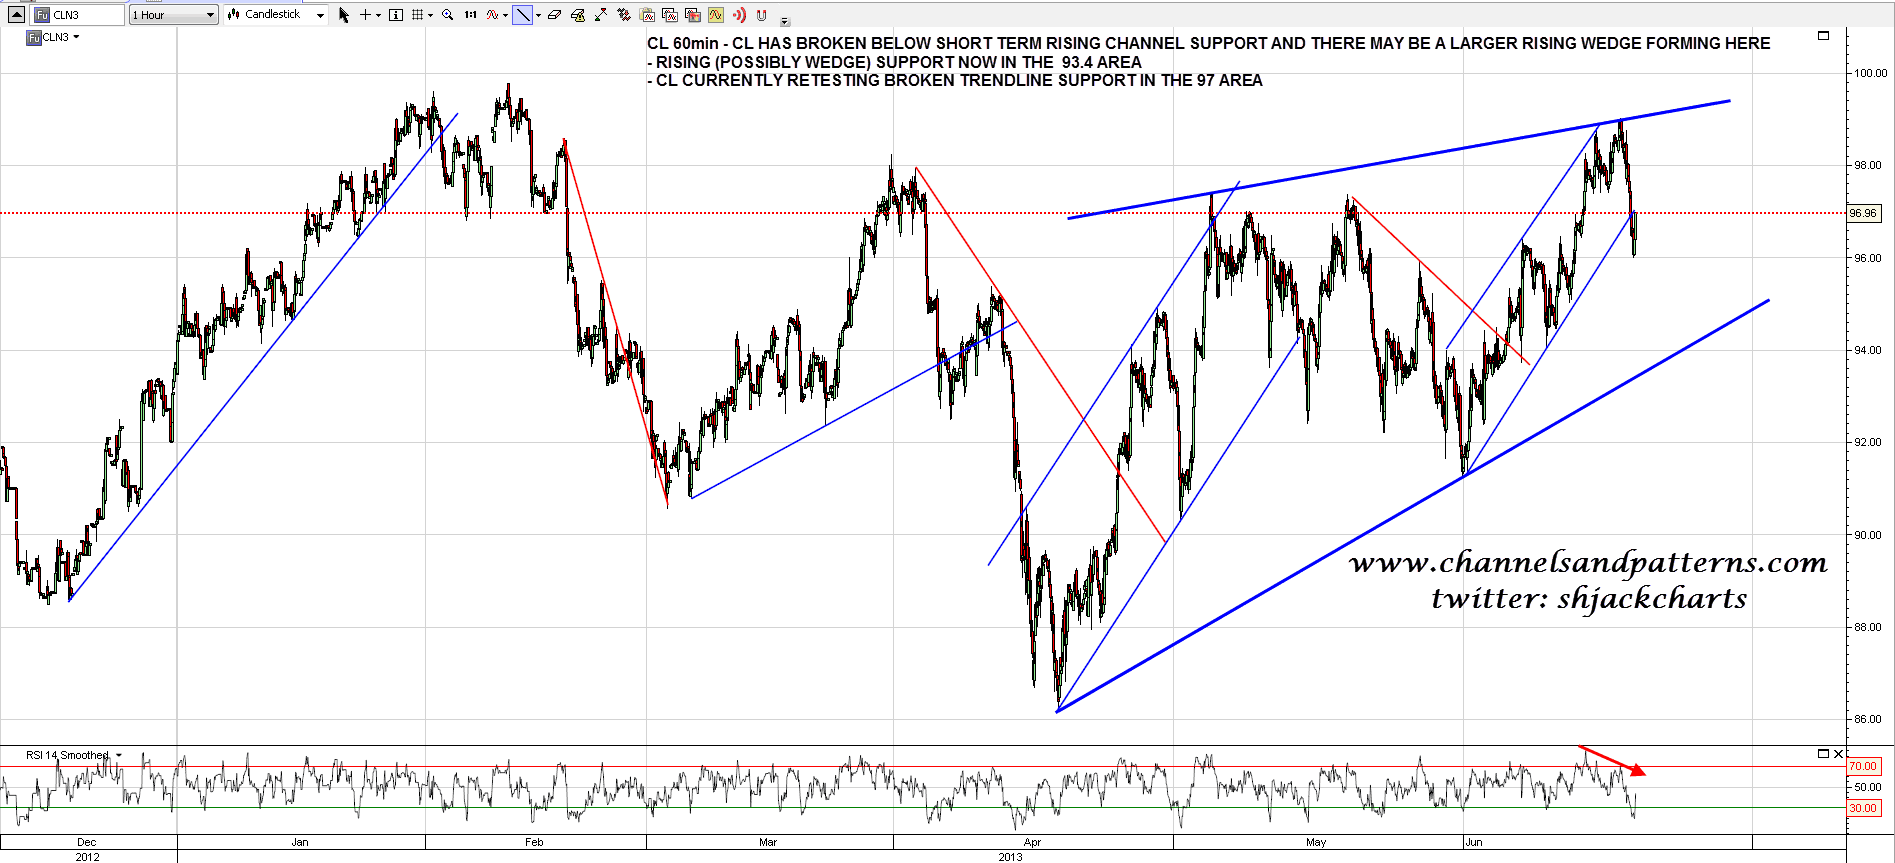
I was saying yesterday morning that retracement soon on CL looked likely and we got that. It went further than I expected however and broke short term channel support. The break at 97 is being retested this morning, but the break is bearish and I’m expecting some more downside. I have drawn in a possible rising wedge forming on CL here and if CL returns to test rising (possibly wedge) support that is currently in the 93.4 area. CL 60min chart:
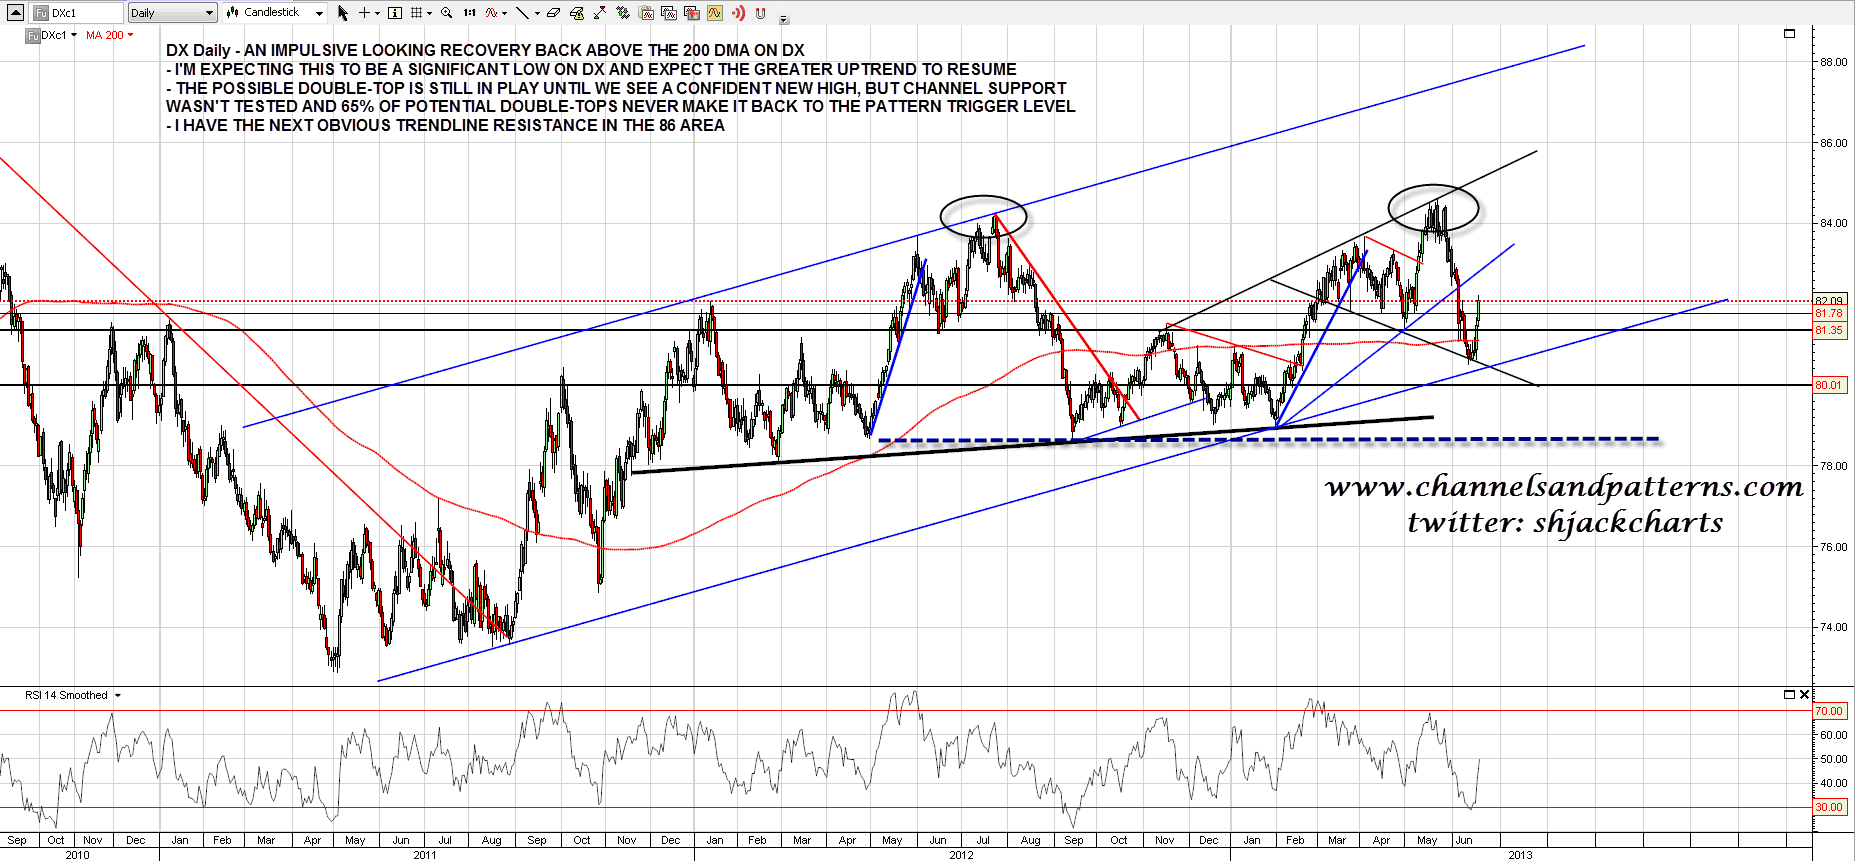
I’ve been watching DX with increasing concern over the last couple of weeks, wondering if we were seeing a major trend reversal. I was therefore very happy to see yesterday’s strong and impulsive looking spike up back over the 200 DMA and broken support at 81.35. I am treating this as a probable significant low and am now looking for a break with confidence over the recent highs with a working target in the 86 area. DX daily chart:
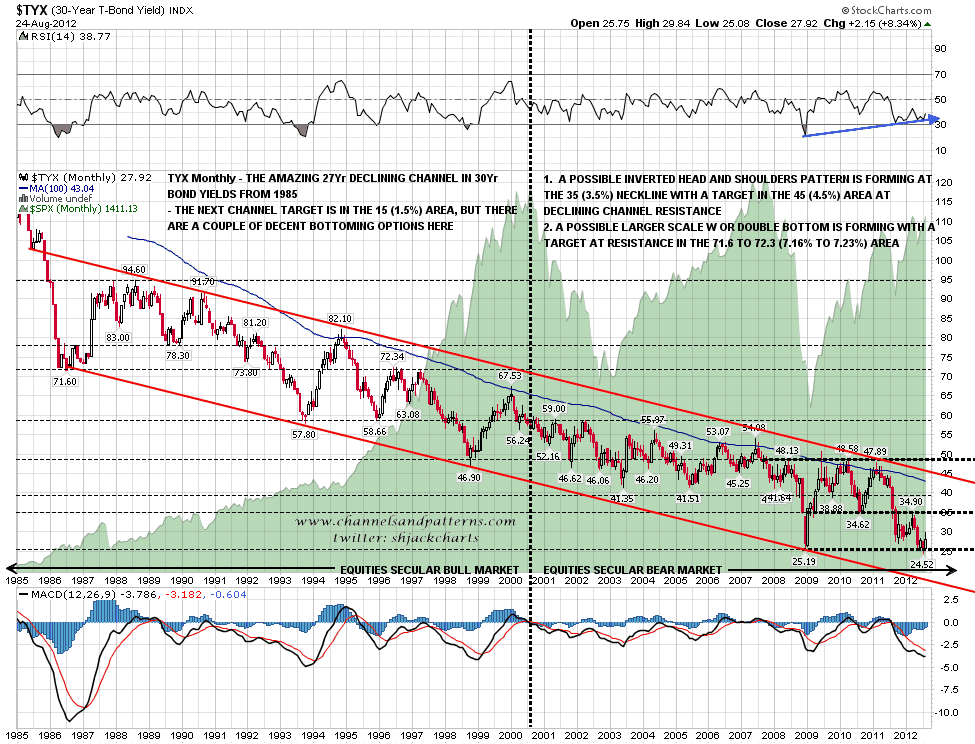
I posted a long term TYX (30yr Treasury Yields) chart last August talking about the possibility that an IHS would form as part of a long term low and here is that chart again. TYX Monthly (LOG) chart (25th Aug 2012):
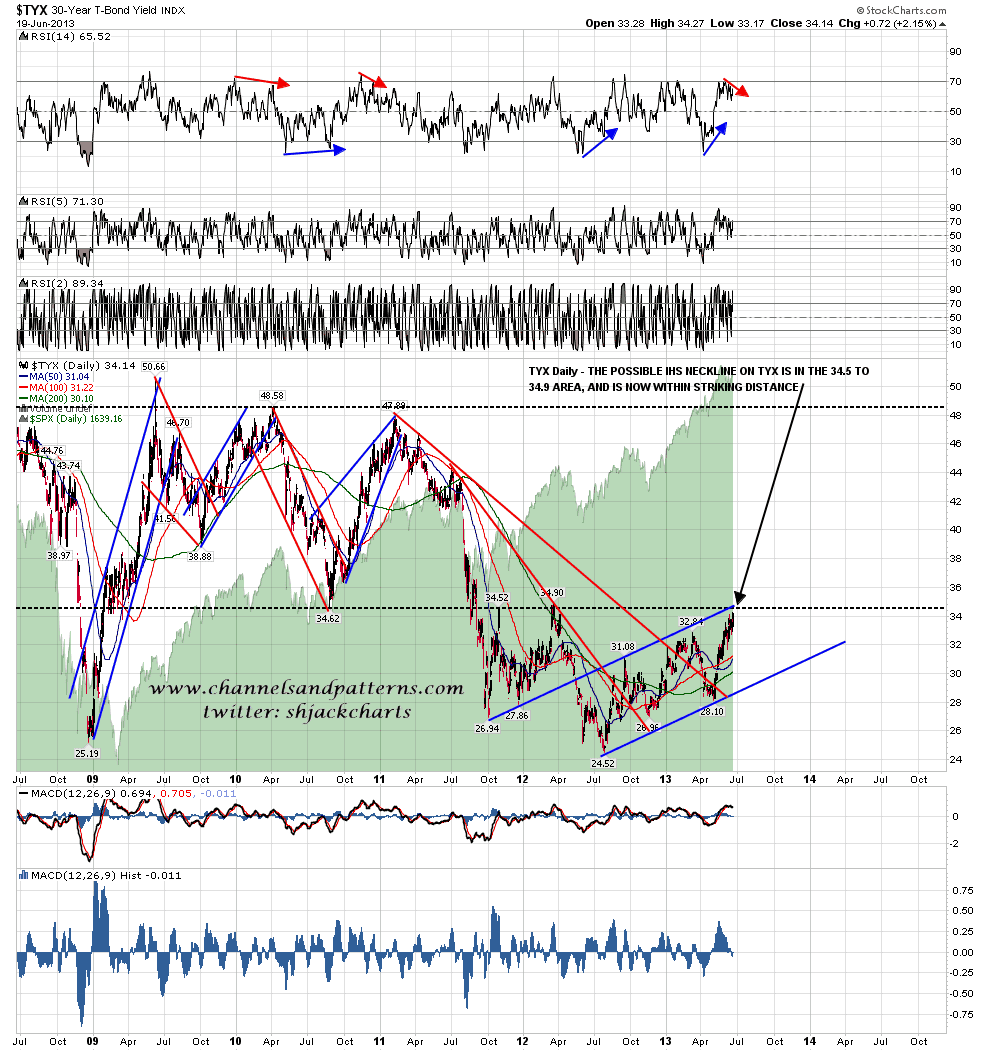
Since I posted that chart bonds have been pounded hard and as of yesterday TYX has now almost reached my IHS neckline. If this IHS continues to form I would expect a very strong rally on bonds soon, and on TYX this would ideally be a right shoulder forming over six months or so with a downside target in the 27 (2.7%) area. We may therefore be close to a big multi-month reversal on bonds and that should be borne in mind by anyone shorting bonds here. TYX daily chart (intraday yesterday):
There’s a big opening gap today and I’m hoping SPX will open below 1615, breaking the wedge. If we see that then broken wedge support may well immediately convert into strong resistance. If SPX opens above wedge support the gap fill has a better shot and I’ll be looking for a test of wedge support in the 1615 SPX area today.
As an aside I’m looking for a decent and reasonable priced wordpress guy to help me with a project. Suggestions welcome.
