
We’ve seen some really boring days on ES recently and yesterday was another of those, with ES spending the entire day testing the 50 hour MA from above. There was a slight break below that overnight but it didn’t hold. Here’s the ES 60min chart I posted on twitter last night after the close showing the narcolepsy -inducing action for the day. ES 60min chart:
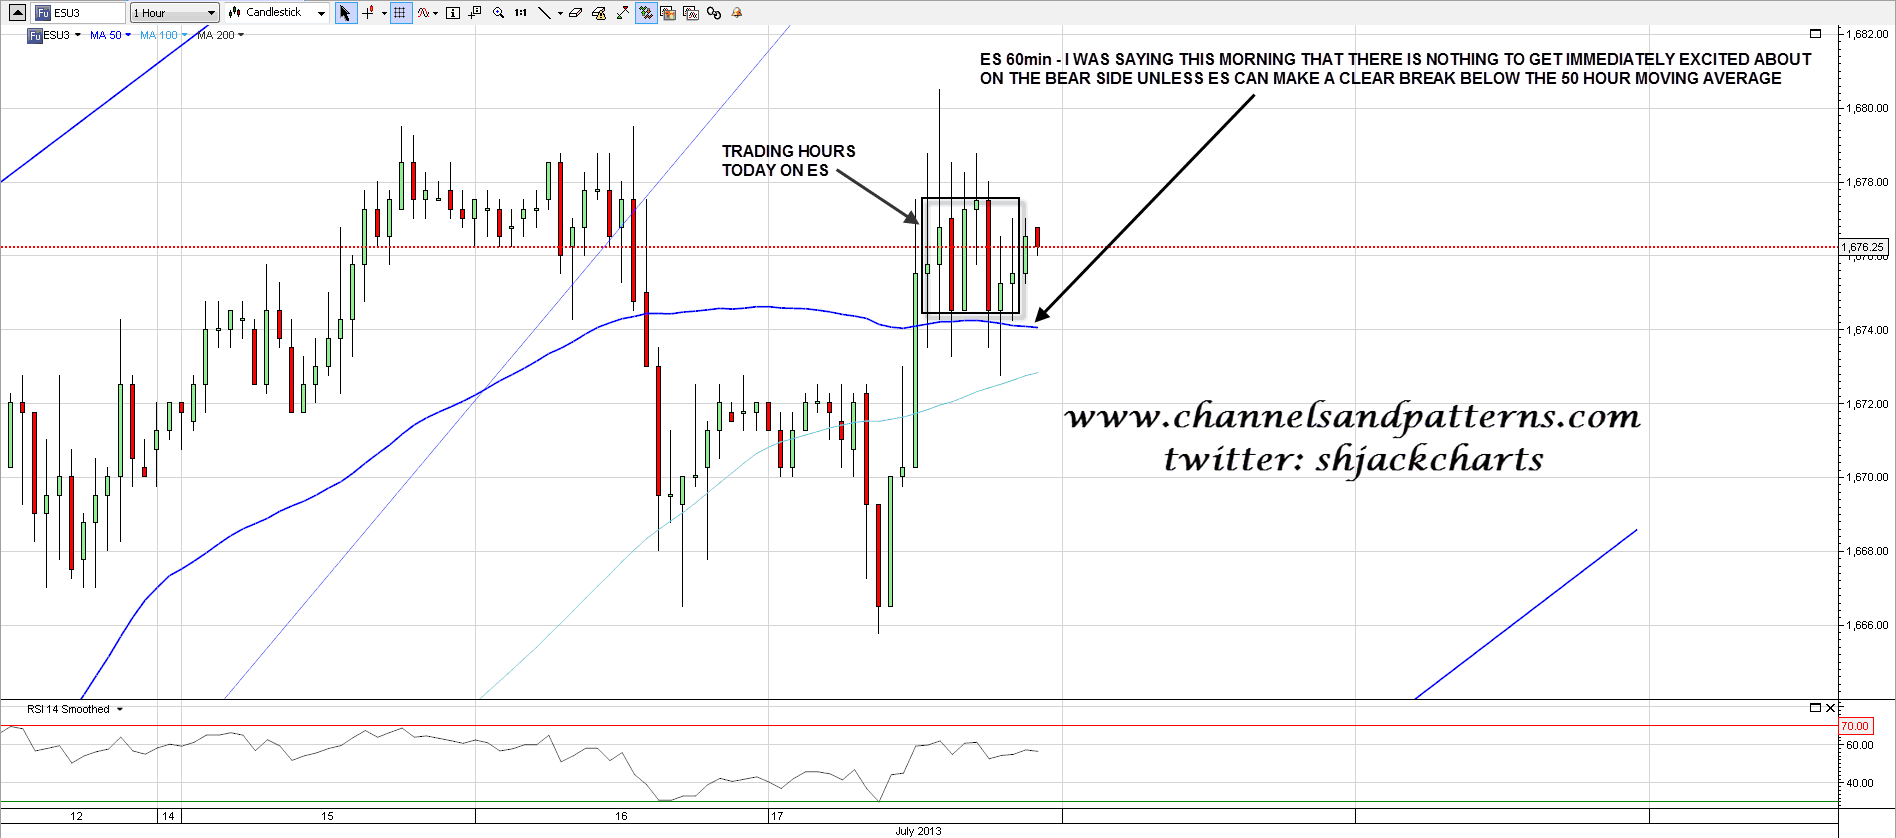
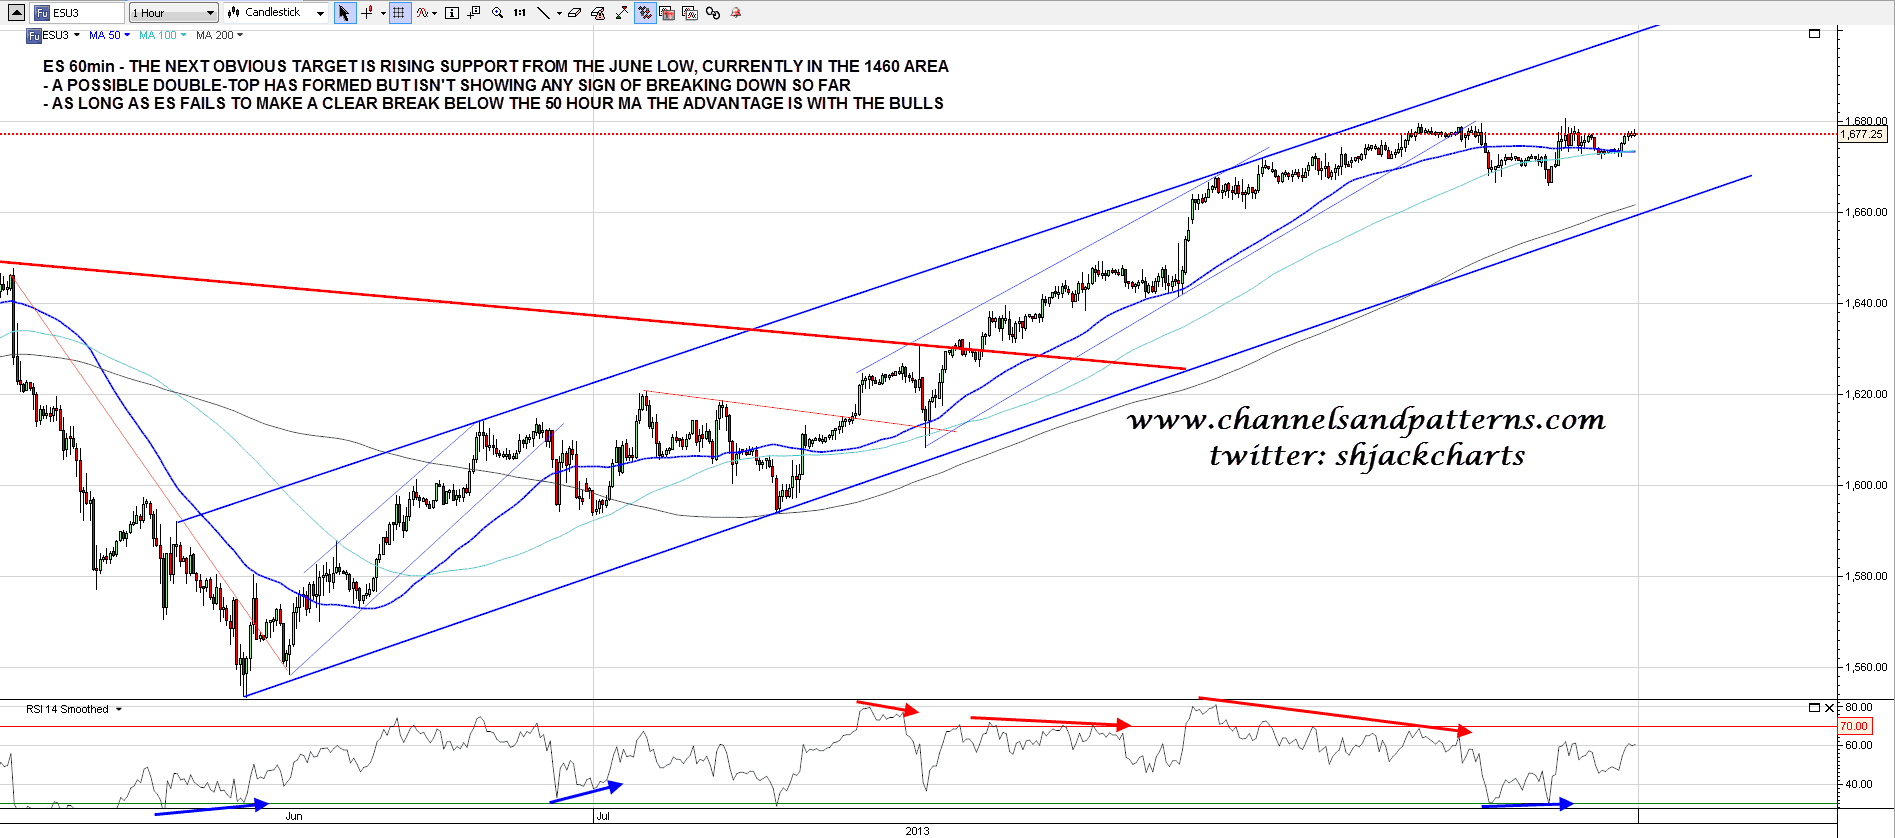
So what are we seeing there? That might have been a bull flag, but if so it would have needed to break up overnight. Equally there is a nice looking possible double-top there as well, but that’s starting to look rather stretched and with no sign of real selling pressure so far. On the rising wedge from the June low the next obvious target is the wedge support trendline, currently in the 1660 area, but there’s no reason to think that ES and SPX couldn’t push up to more definitive new highs before that trendline is hit. ES 60min chart:
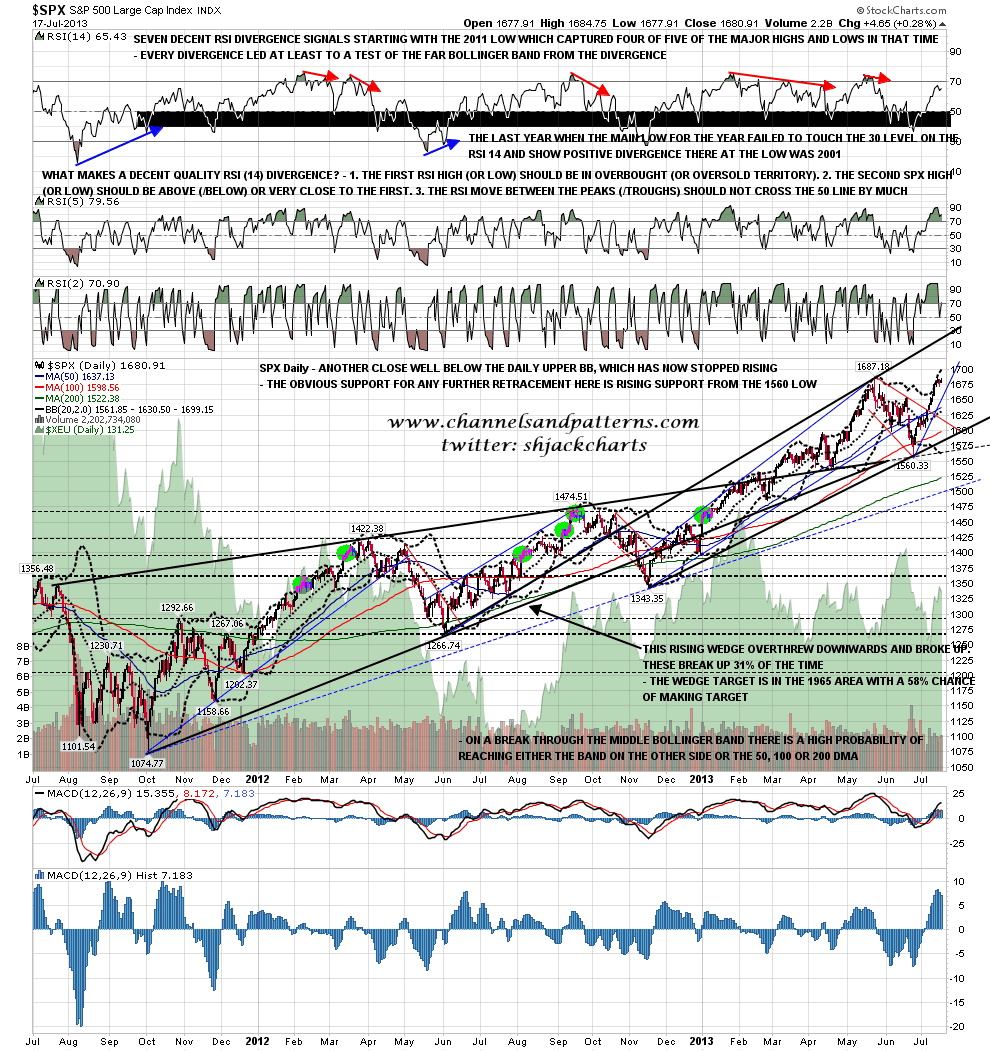
If we do see another push up is there an obvious target for that? Yes there is. At the close yesterday the weekly upper bollinger band was at 1693 and the daily upper bollinger band was at 1699. Both are attractive targets for a further push up, and if those were hit then we would most likely see a larger retracement start from there. SPX daily chart:
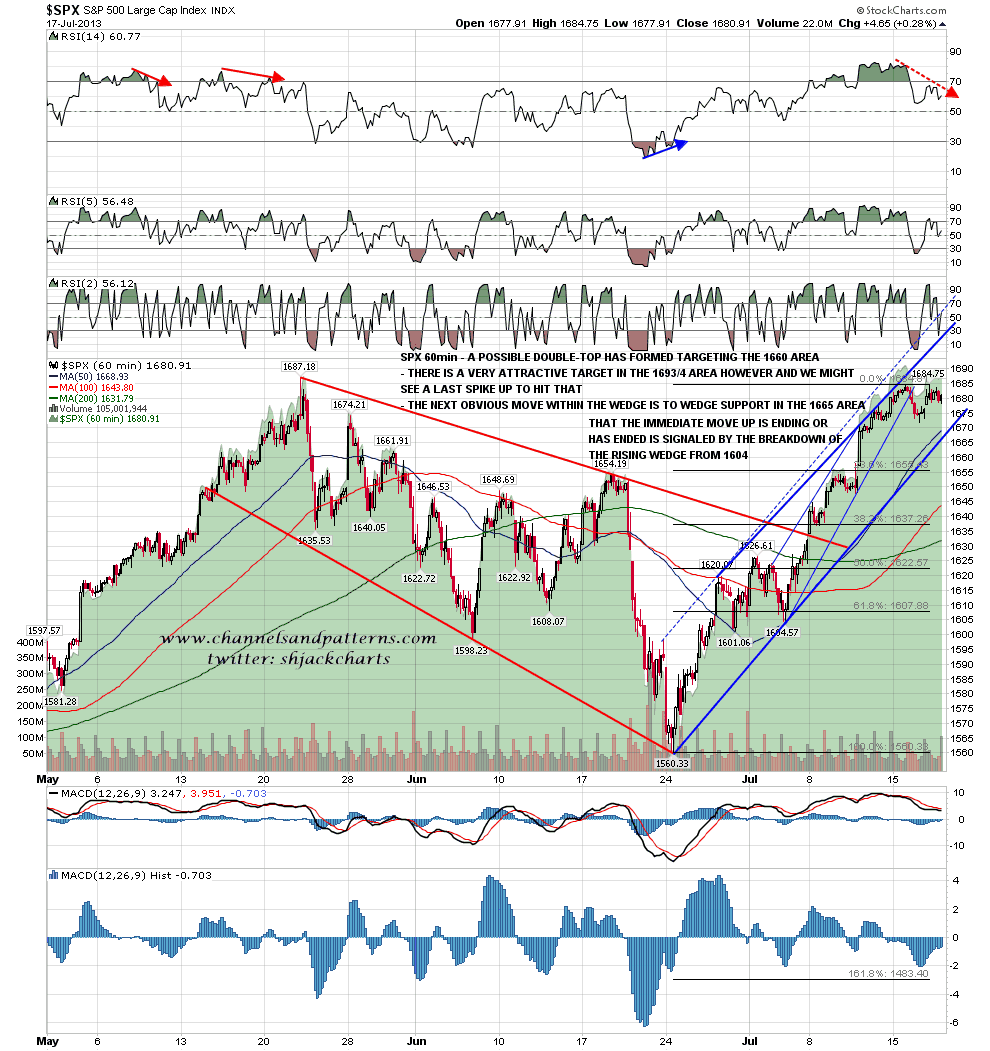
Rising support on SPX is in the 1655 area, very close to ES rising support, which isn’t always the case. There is a possible double-top forming there too and the RSI and trendline setup is arguing strongly for a more definite retracement soon, but we could see a push up to the 1690-1700 area without compromising that setup. SPX 60min chart:
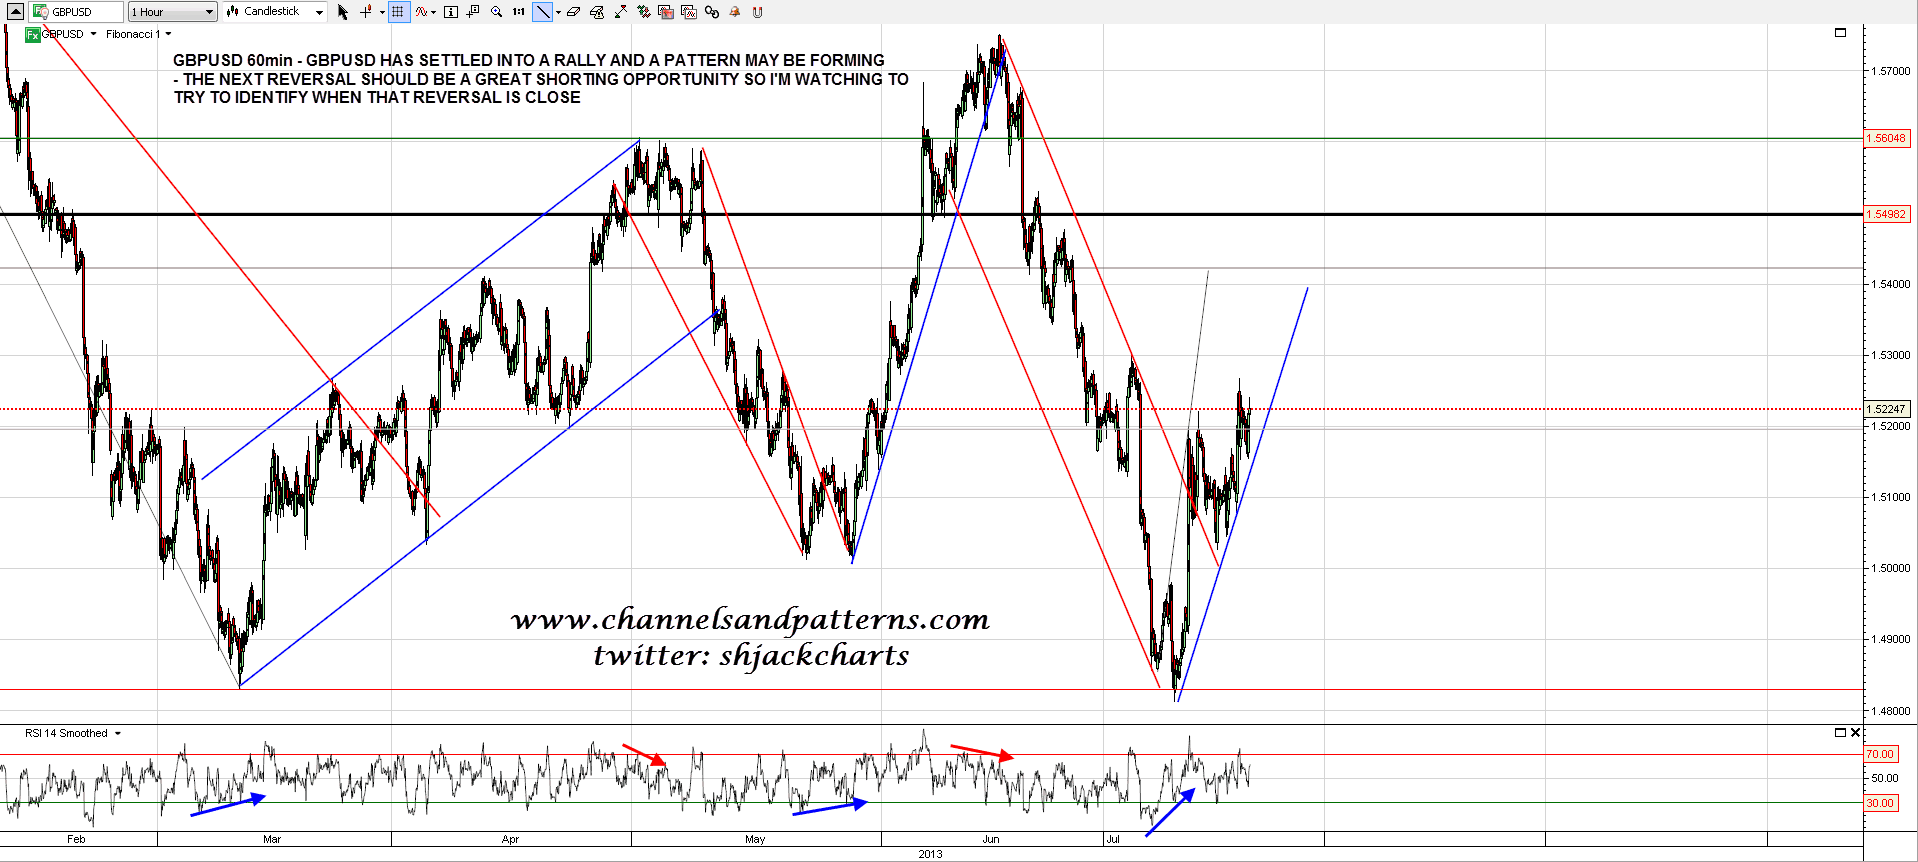
On other markets GBPUSD is settling into a slow rally. The next reversal downwards may well be the start of a very big move, so I’ll be watching for signs that the rally is topping out. GBPUSD 60min chart:
There is still a possible double-top forming on CL, but so far it has more of the look of a bull pennant. I am reminded that the next obvious upside target is in the 110.50 area, and that this target has not been tested yet. We’ll see how this develops but we are waiting for a break in either direction to help define direction. CL 60min chart:

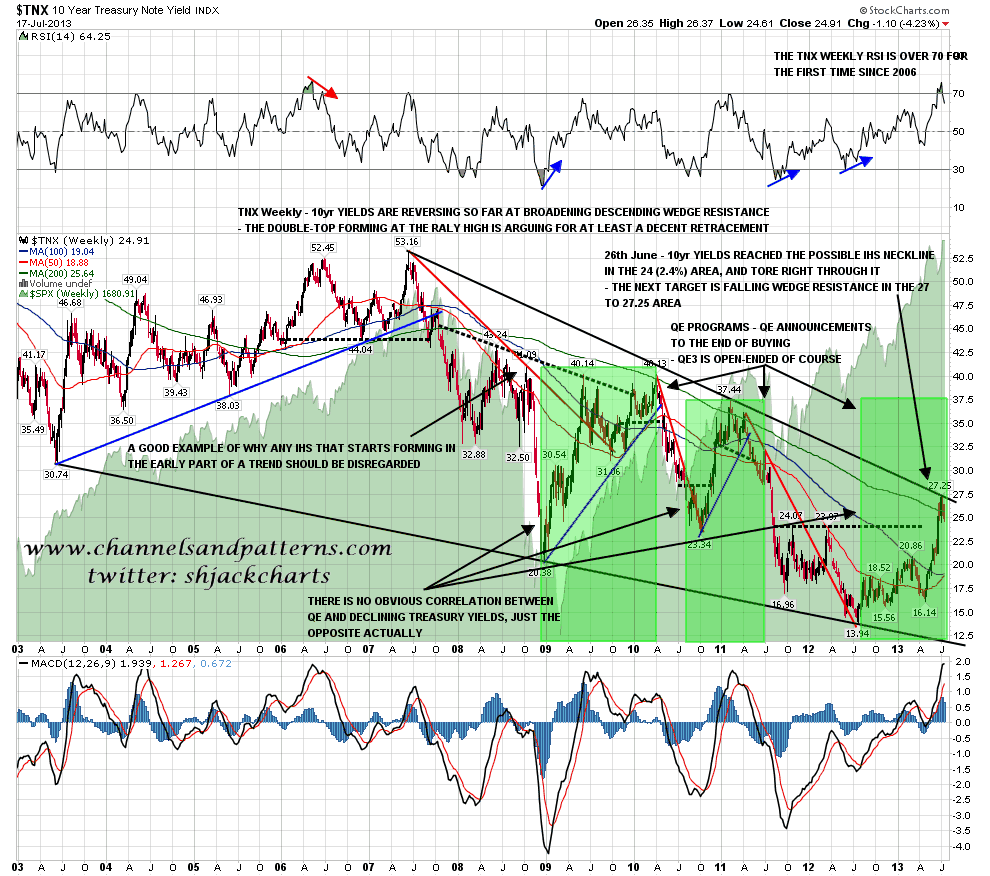
I’ve been posting bonds charts every day for the last couple of weeks, and at the risk of boring everyone who doesn’t trade bonds, I’ll be posting two more today, as I think that this is perhaps the most interesting of all the trade setups that I am watching at the moment. On the 10yr weekly chart TNX hit and very slightly overshot resistance on the broadening descending wedge from 2003, which is often an indication that the wedge will break upwards on the next hit. I gave the target range on 26th June at 27 to 27.25 and the current high is 27.25. There is no negative divergence on the daily RSI, but at the high RSI was over 70 for the first time since 2006. TNX weekly chart:
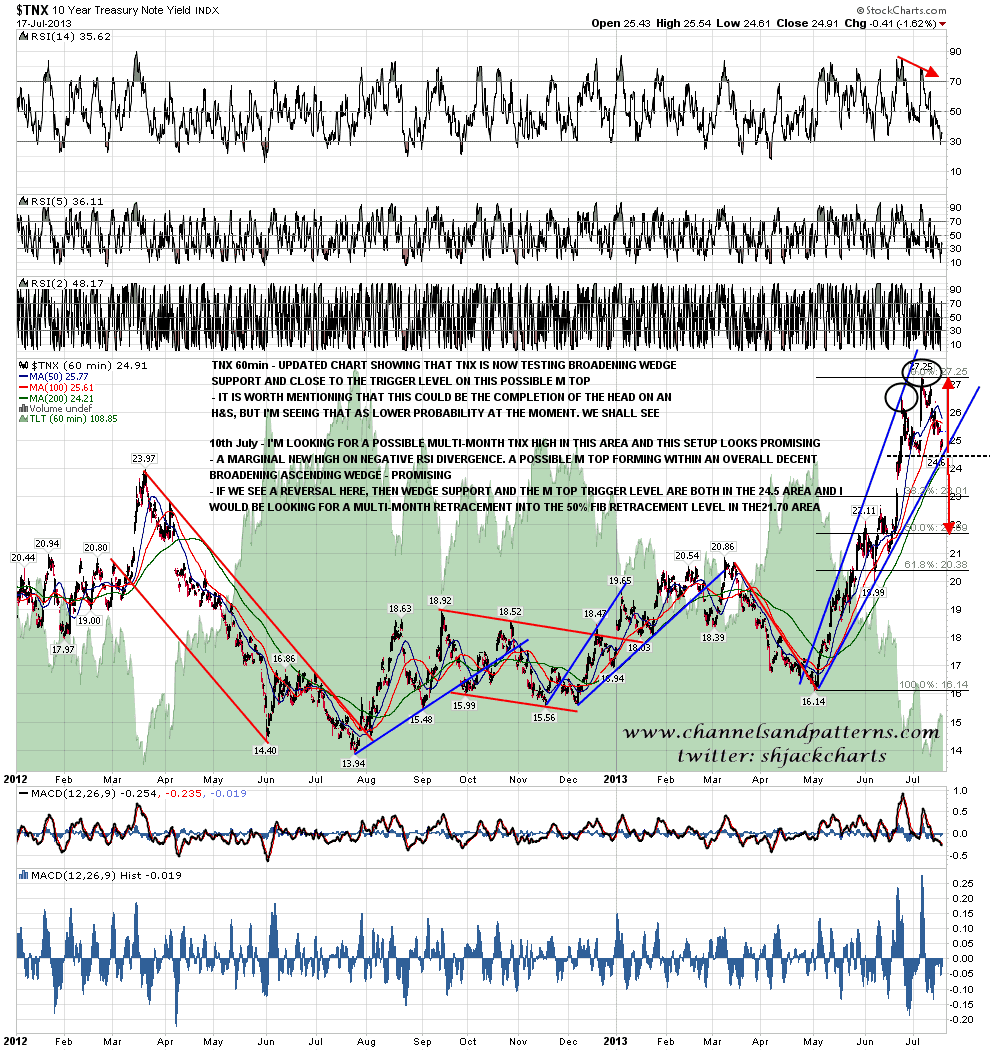
Will TNX reverse at wedge resistance? I think so yes. The setups on ZB and TLT are supportive, and on the TNX 60min chart we can see a nice looking M top forming on negative RSI divergence. TNX hasn’t yet broken below broadening ascending wedge support and the double-top trigger level, but once it does the M top target and the 50% fib retracement level are both in the 21.7 area. TNX 60min chart:
As I’ve been writing ES has been testing strong resistance in the 1680 area. If that breaks up I’d be seeing the ideal target in the 1688-90 area, and that would be a nice looking swing short entry for the deeper retracement that I’m expecting to start soon.
I’m going to be on holiday from Wednesday next week through to the end of the following week. Normally I would still do short posts every day or two while I’m away, and possibly for that reason my wife has chosen a destination with very limited internet access. I will assess my options when I get there. It may be however that I’m not able to post any charts from Wednesday 24th July through to Friday 2nd August.
