
Hello Slopers,
This is a late post since due to a short summer hiatus (and it won’t be the only time this summer either). But I wanted to get these charts out before Bernanke speaks today (assuming Tim gets it posted before then). Why? Do I think they might help predict what is coming? Not a chance. No technical indicator can do that. In a spastic world where one guy says something and the market goes down and then he says something slightly different and the market goes up – well, forget predicting anything! Indeed, even if you could predict what someone was going to say, you would then have to make a secondary prediction about how the market would react. Suffice it to say that someone else’s words are completely out of your control.
The charts have value in establishing statistical parameters around price movement and trend analysis. I should remind readers that these indicators are mostly about statistical break outs (momentum) and trend identification. In a situation where market volume is light, price momentum is less reliable. In the case where a market is moving sideways, trend analysis breaks down. This is why I use indicators like the Squeeze and VWAP. I want to see if I have enough directional volatility as well as how far price has moved away from the VWAP. When using technical indicators for analysis, it is important not to delude yourself about what they are telling you. You need to understand how they work and what their limitations are. ‘Nuf said.
The chart of SPX below shows that our previous exit signal has been reversed back to a long signal. This is what has happened in the past and I’ve noted this with the magenta arrows. It was a concern I expressed in a previous post a few weeks ago when we got the down arrow. I stated “previous short set-ups have been shallow retracements. Since I cannot predict the future, I use prior history as an indicator of what might happen.” In that post I initiated a pilot short position using options that expire in August. I will now review the position and close it out. Being wrong about predicating the future is OK. Staying wrong after getting additional information is not. Of course we do have more information coming in a few hours.
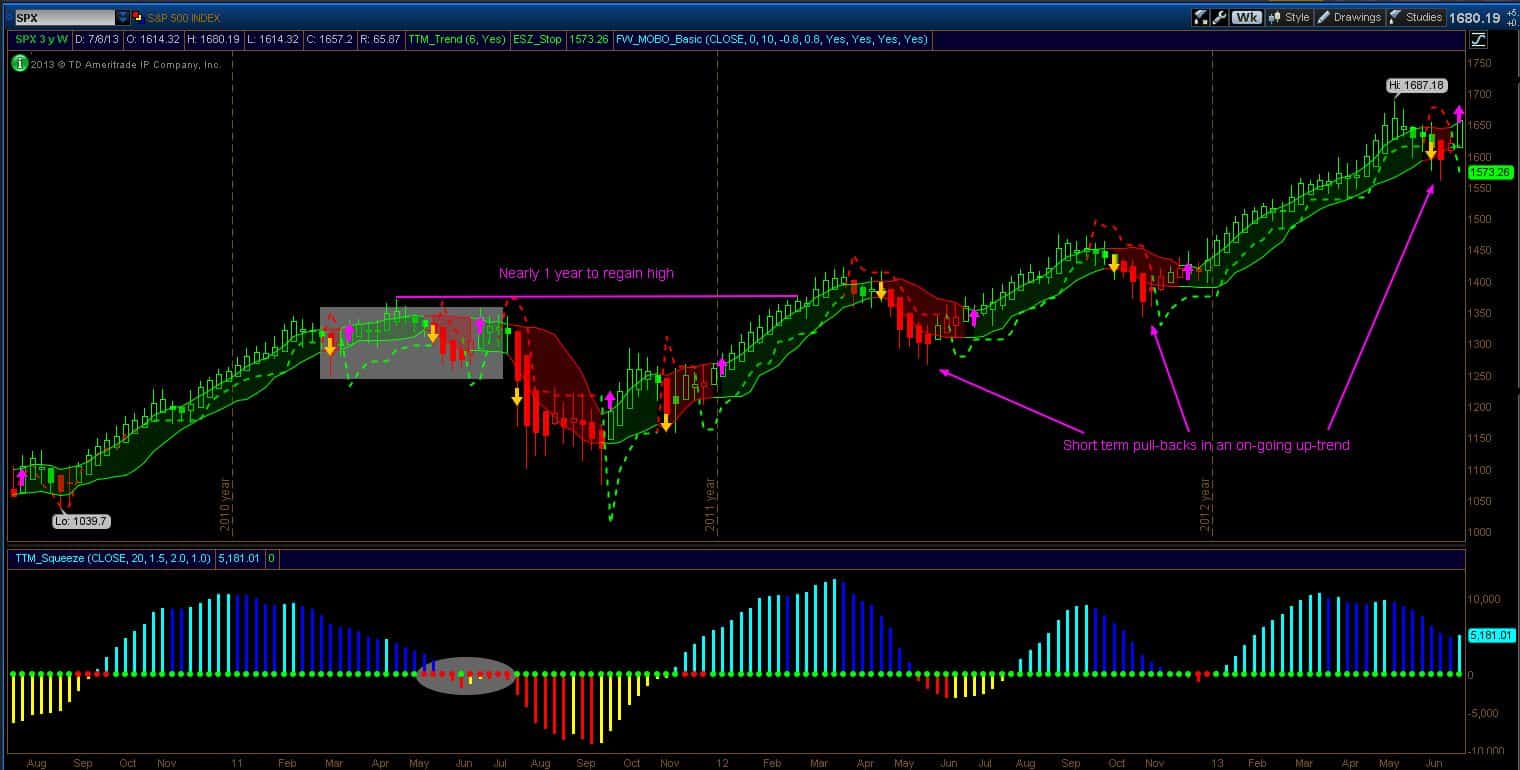
What else am I seeing on the chart? Well, buying momentum has been declining and even though we had a good pop this week due to the Q&A with Bernanke, it is still declining and has been declining as the market rises. This is just a warning sign as momentum, especially in the lighter volume of late spring and summer makes it a more difficult read. The other area I’ve highlighted is a trend-followers worst problem – the sideways market. We saw this in the Spring and Summer of 2011. This is something to always be on the watch for and presently we have similar characteristics (initially a rising market on building momentum, then a rising market on falling momentum, then chop around the highs, then a fall). I don’t know if we will see a repeat of 2011 but I am wary of it.
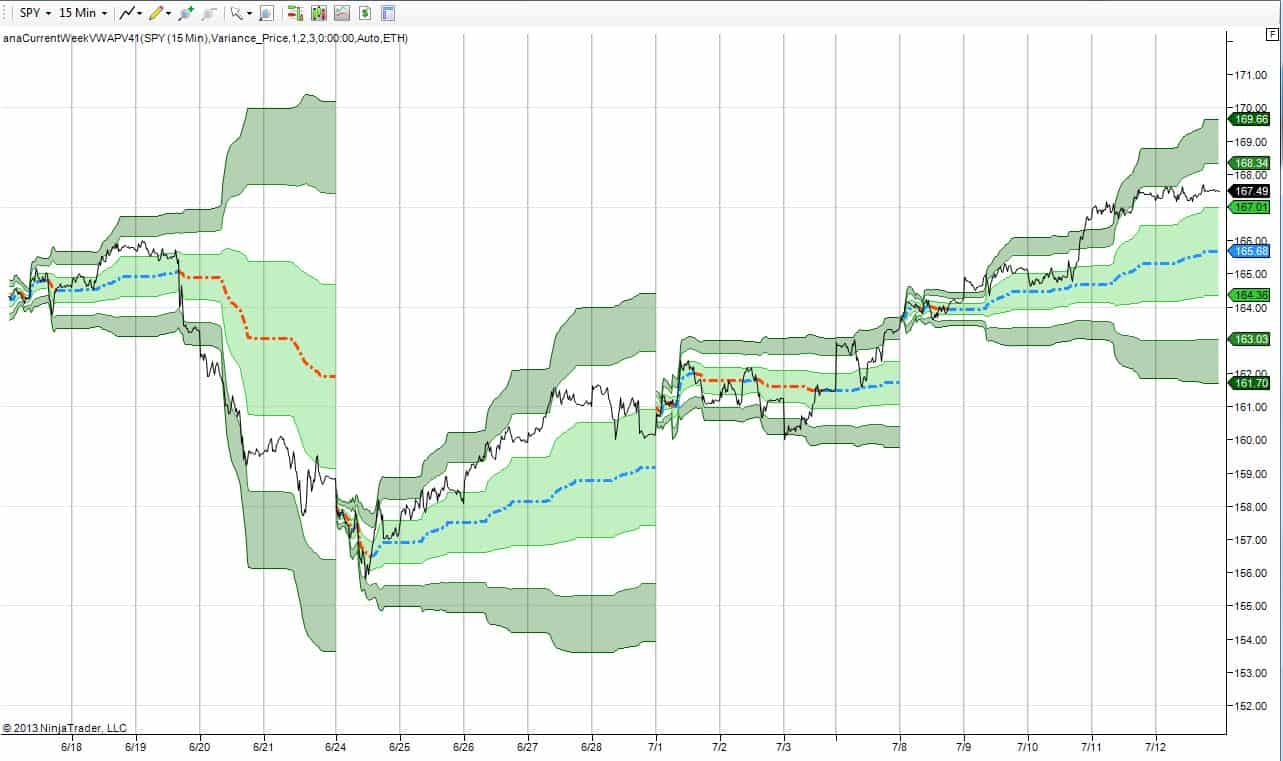
Below is the weekly VWAP. Knowing that volume is lighter in the summer, I want to see how price is moving around the VWAP. You can see that the Bernanke pop of last week moved price above the weekly VWAP. This means the rising market for a few days was done on light volume. That in itself isn’t particularly important. What is more important is that since late May, the weekly VWAP has been declining. That is another warning sign. If the price at which the most volume is trading is trending down, even though the spot price is moving up, then some large market participants have been distributing.
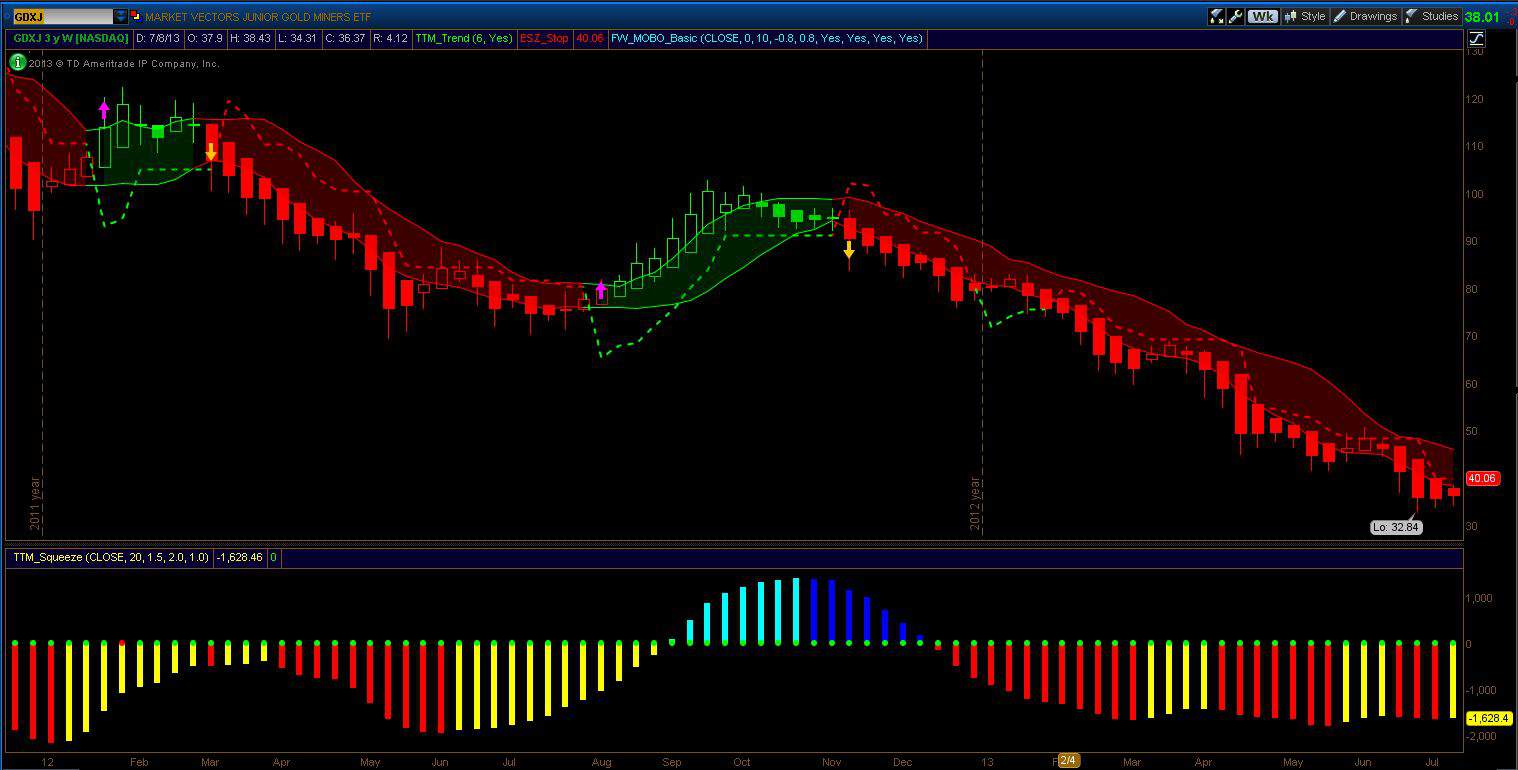
Finally, the gold charts (all below). I won’t say much here as I’ve been discussing gold in more detail in prior posts. Price action for gold stocks and the miners is sitting exceptionally close to the short stop exit line. We may see a change in this down-trend this week. I don’t know but all trend change eventually and that is why I have been doing some research into possible long positions. The charts don’t show any trend changes yet but the down trend is getting mature. Of course we could simply consolidate at these low levels too. Time will tell.


Good trading!
-Dr. G
