
We seem to have settled into a pattern of interesting mornings and dull afternoons that close near a daily bollinger band. Yesterday’s close was at the daily middle bollinger band (or 20 DMA) for the third straight day. The lower bollinger band is now close below at 1678, and the upper band not far above at 1708. With all the action below the middle bollinger band this week I am cautiously expecting to see the lower band tested next. SPX daily chart:

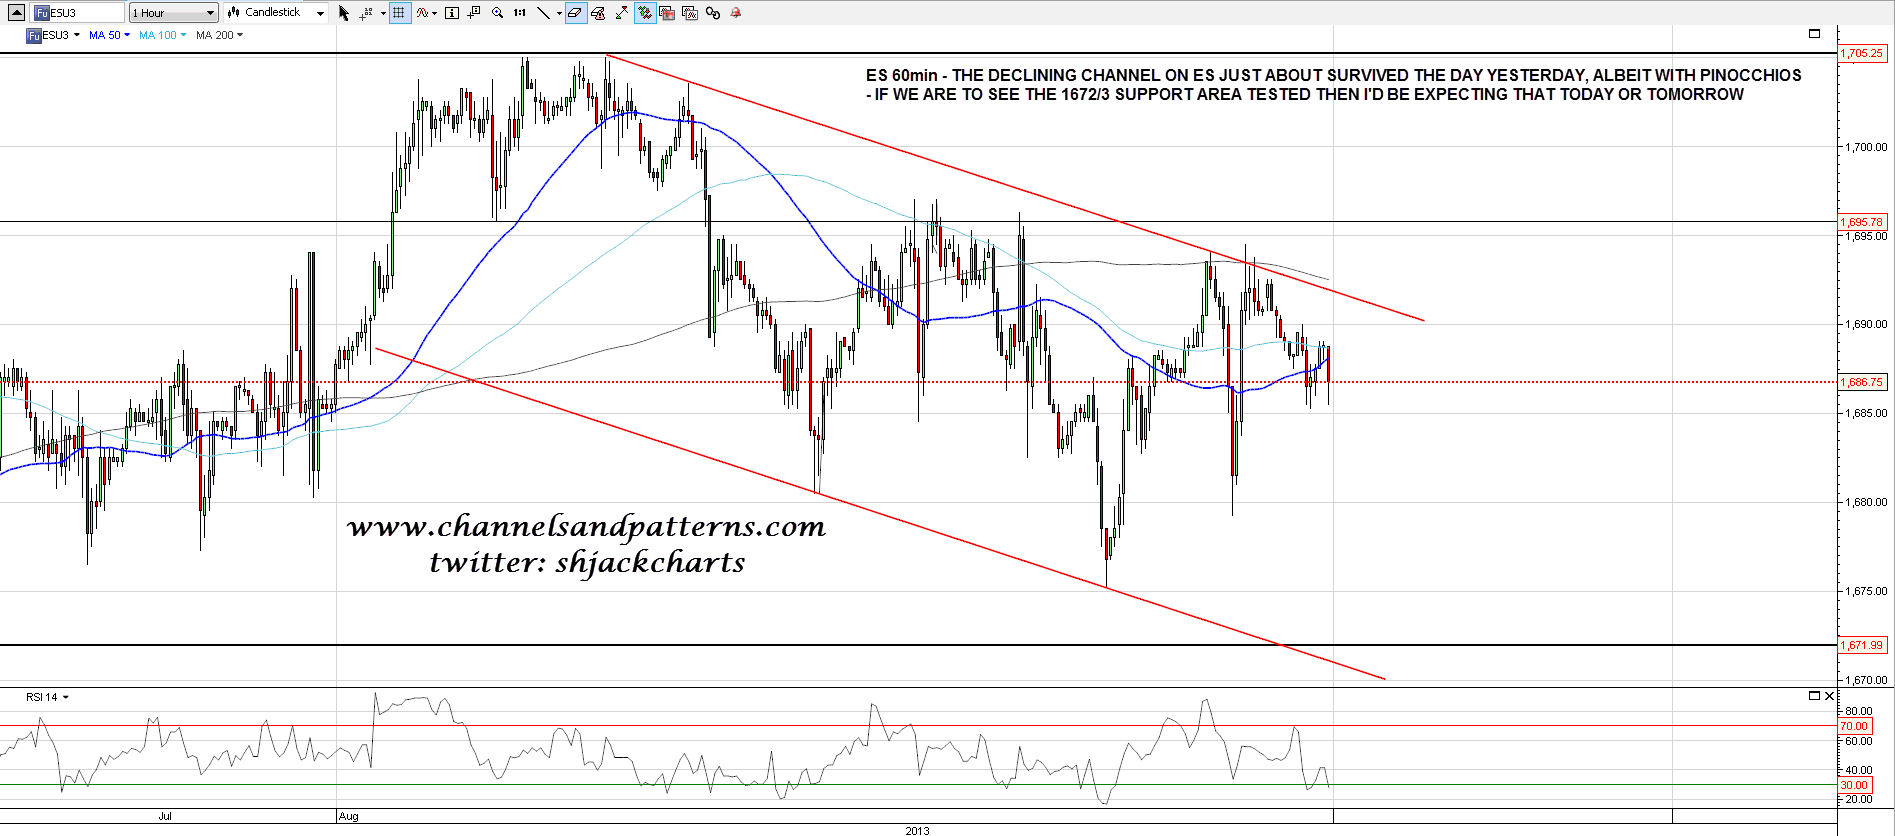
The declining channel I posted on ES yesterday morning survived the day, just about, though with pinocchios and if we are to see a test of 1672/3 area support then I would expect to see that today or tomorrow. ES 60min:
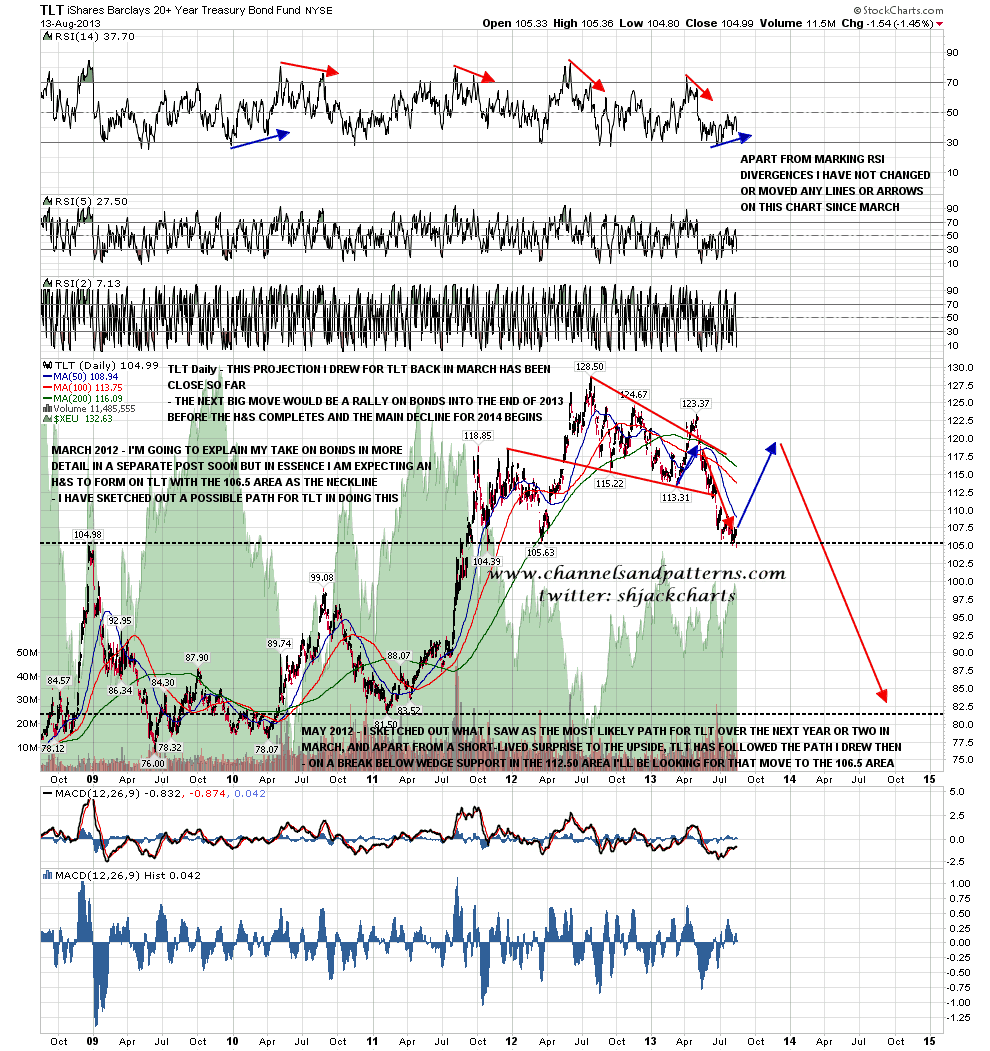
I posted a TLT chart back in March with a projection of what I though we might well see on there well into 2014, and at this stage on that chart I projected a big rally to start to form the right shoulder on an overall H&S pattern. Here is the updated version of that chart, which has been a decent performer so far, and you can see that the 105 support area is still holding as of yesterday’s close. TLT daily chart:
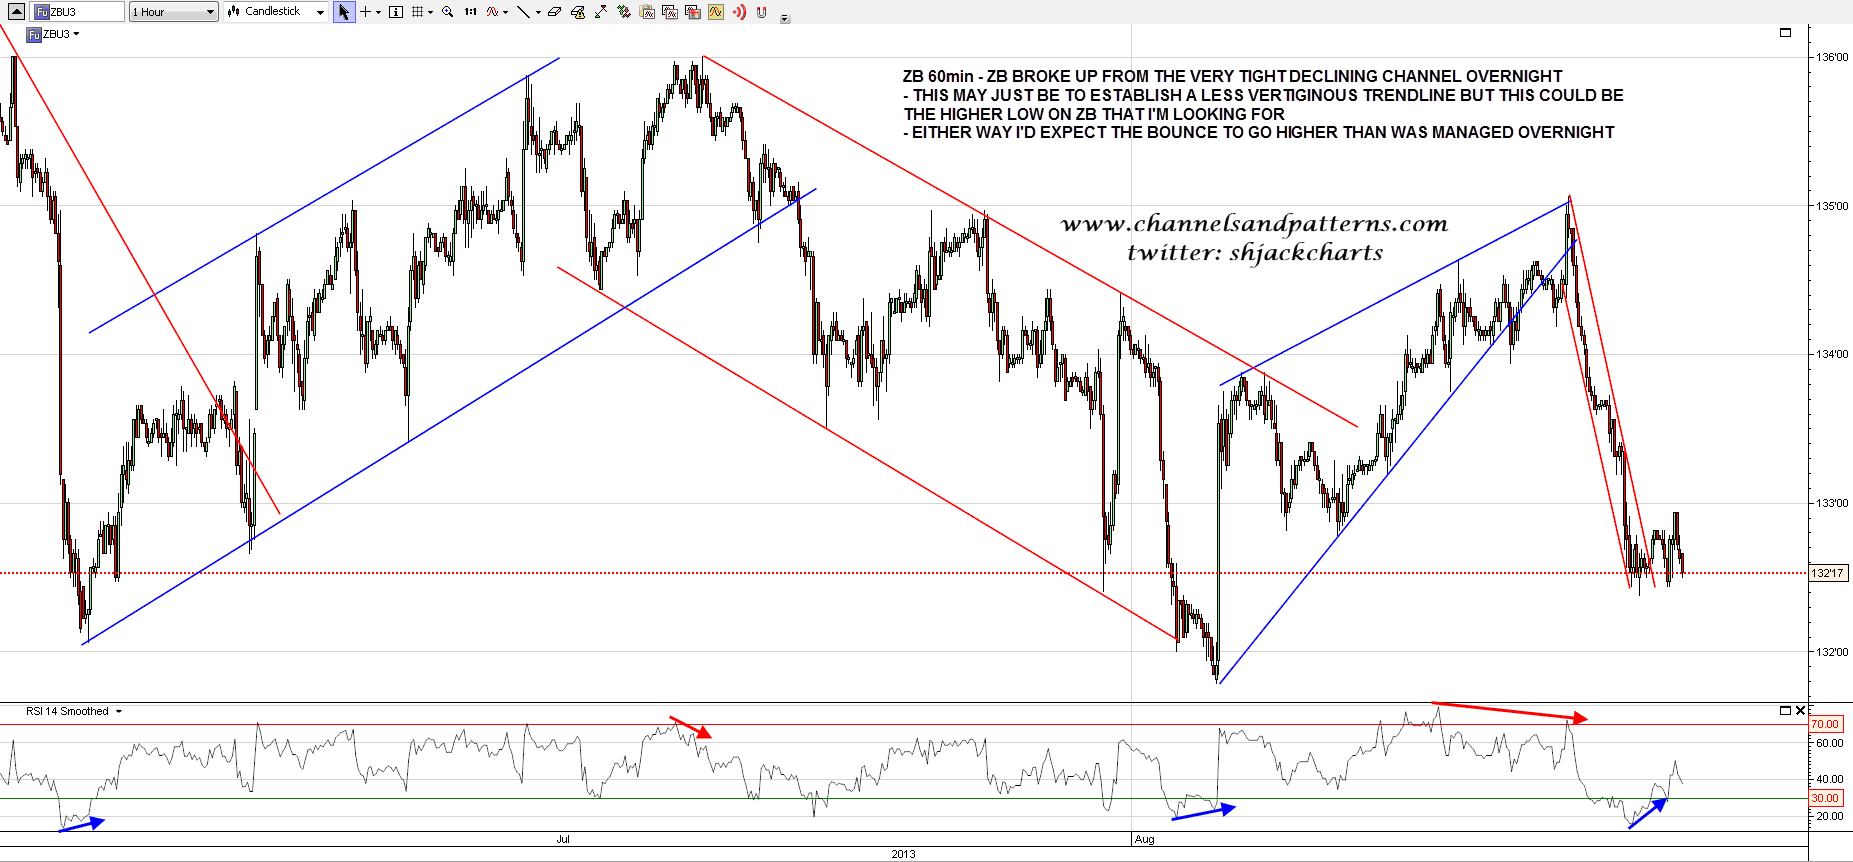
I mentioned yesterday morning that I was looking for a higher low on this move down on ZB and that’s obviously part of this overall scenario on bonds for the rest of 2013. Will we see that higher low on ZB? Very possibly, as the very tight declining channel from the high broke up overnight. This might just be a retracement to establish a less vertiginous resistance trendline, but equally it could be that this strong multi-month rally on bonds that I have been forecasting is in effect starting right here. Watch this space. ZB 60min chart:
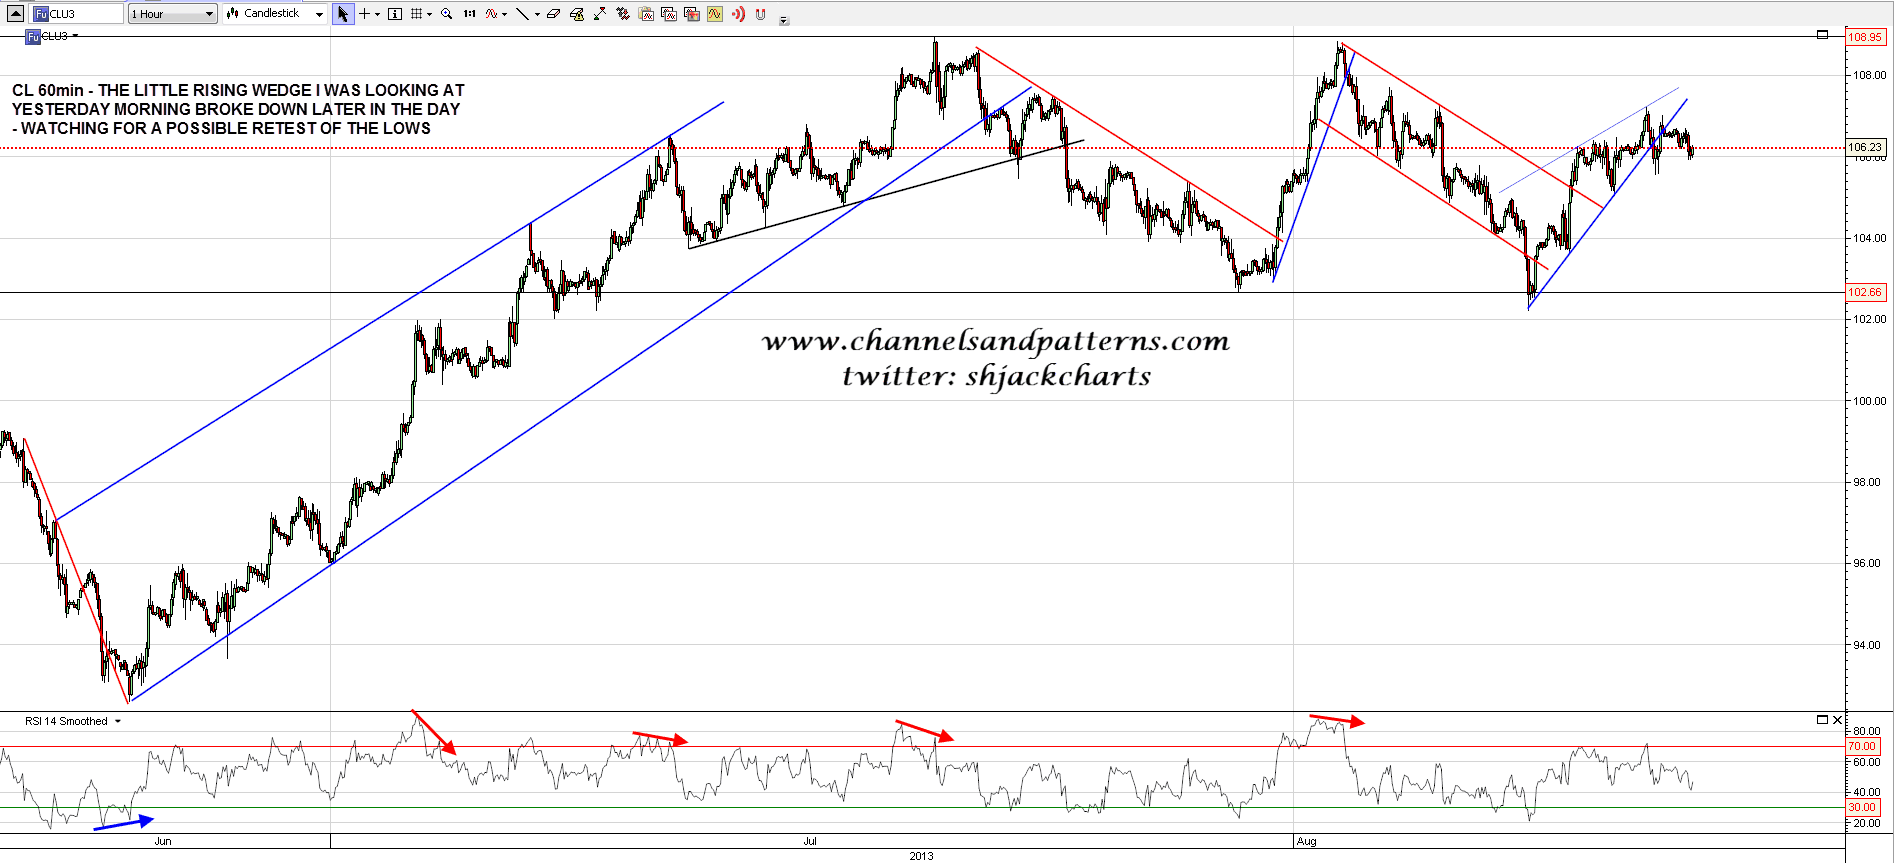
On other markets CL broke down from what looks like a small rising wedge from the low. It isn’t a great pattern but we could see a retest of the lows and the overall double-top setup is still in play here. CL 60min chart:
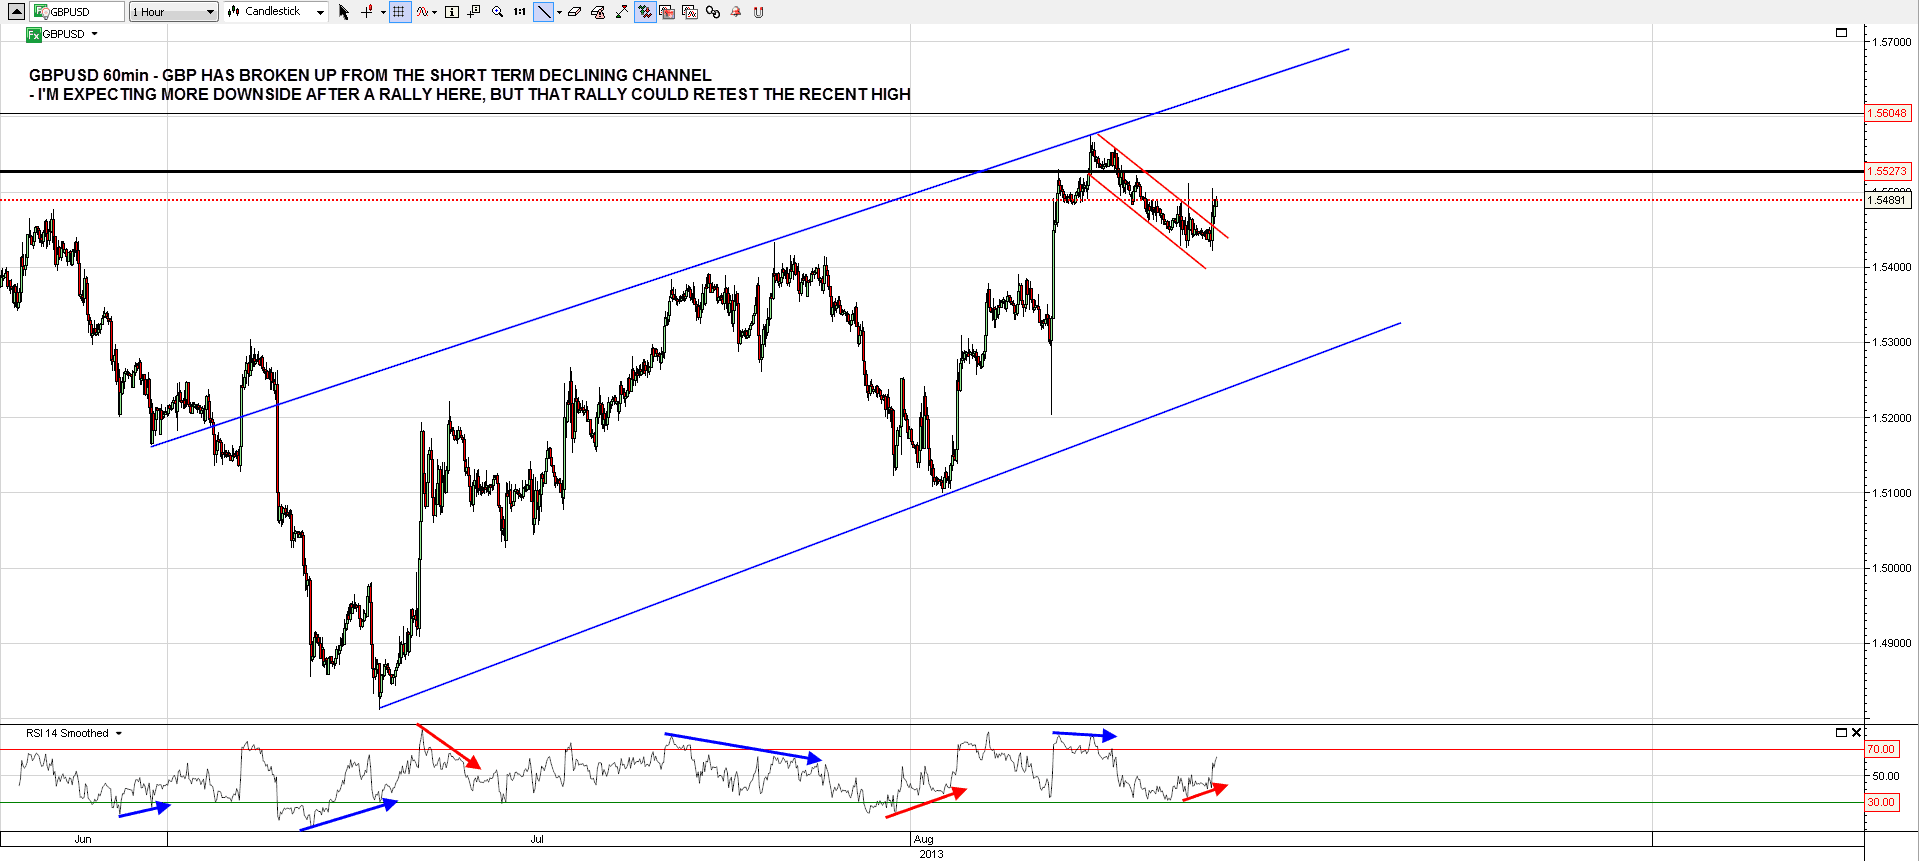
GBPUSD has broken up from the small declining channel here and may establish a larger topping pattern with a retest of the highs. Regardless of that there is likely to be more consolidation or downside on GBPUSD here. GBPUSD 60min chart:
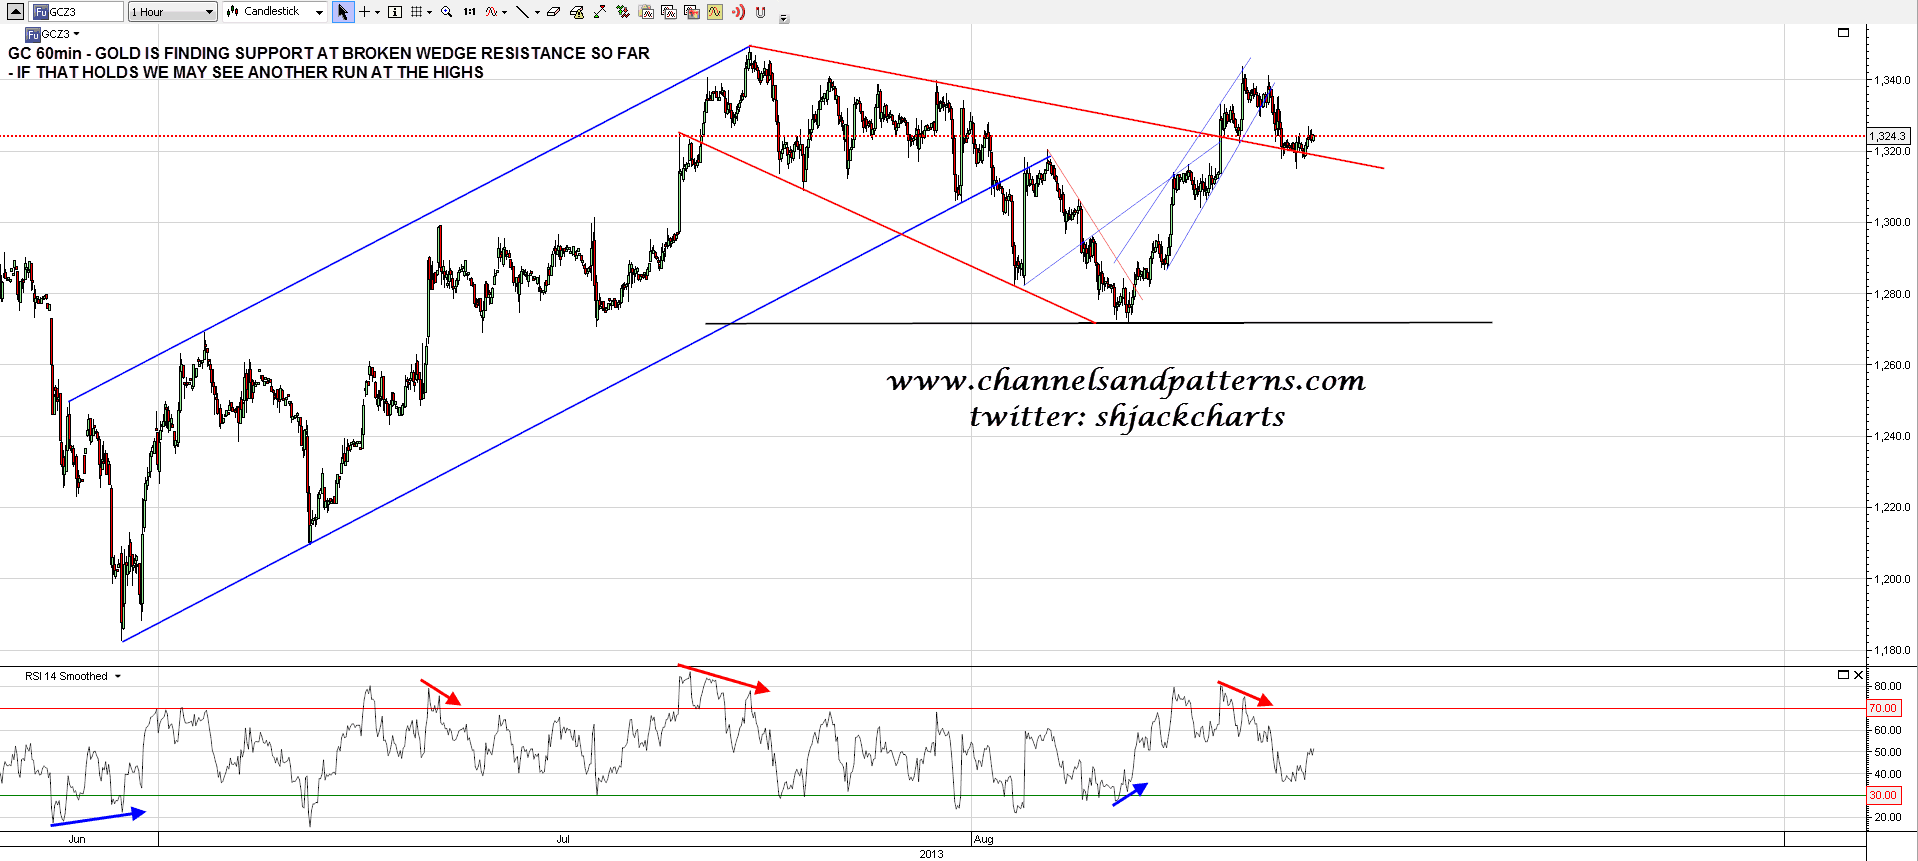
GC has fallen to retest broken wedge support but that is holding so far. As long as that holds we may see a retest of the rally highs. If it breaks then the trigger level for the possible double-top that has formed is at 1271. GC 60min chart:
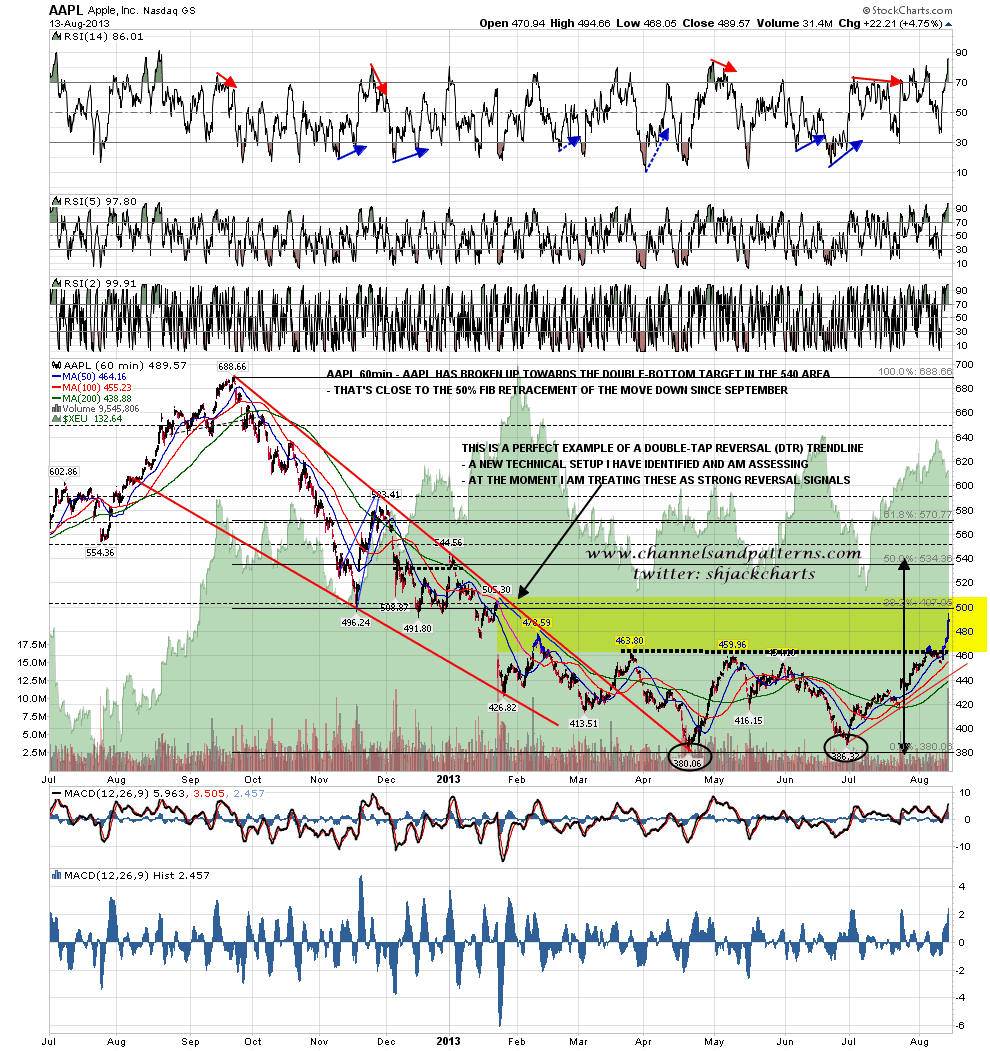
AAPL had a very strong day yesterday and the reversal setup there that I have been carefully tracing through since March is finally delivering. The double-bottom target is in the 540 area and I’m expecting to see that target made. AAPL 60min chart:
For today I am expecting a whippy morning, probably down, and a dull afternoon, probably grinding up. A break below yesterday’s low at 1679.25 would set up a run at main support at 1672/3 ES. A break over yesterday’s high at 1694.5 would set up a possible test of the 1705 highs.
