
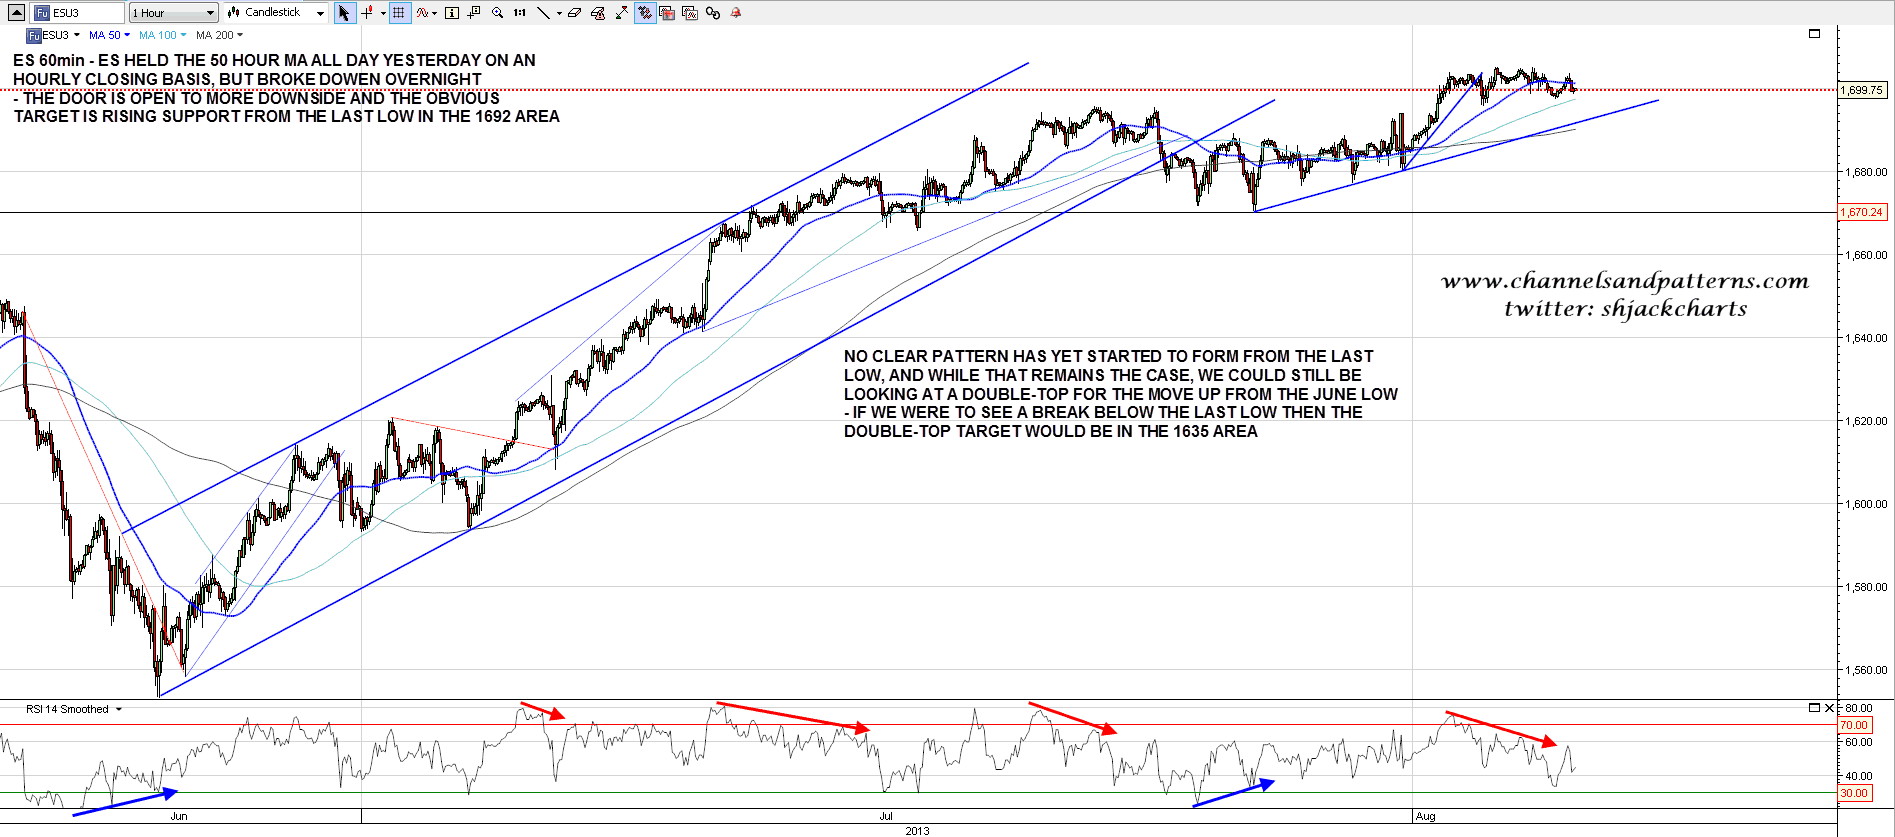
There’s not a huge amount to go on in the short term equities charts at the moment and while that remains the case it’s worth remembering that most or all of these charts are still in the right areas to be forming the second highs of double-tops for the move up from the June low. I don’t think that’s what we’re looking at here but it should be borne in mind, and in the event we were to see a sharp breakdown from here then the target on ES would be the 1635 area. As I said, worth bearing in mind but not the most likely scenario at the moment.
ES held the 50 hour MA on an hourly closing basis yesterday but broke below it overnight. That opens the door to more downside and the obvious target is rising support from the last low in the 1692 area. ES 60min chart:
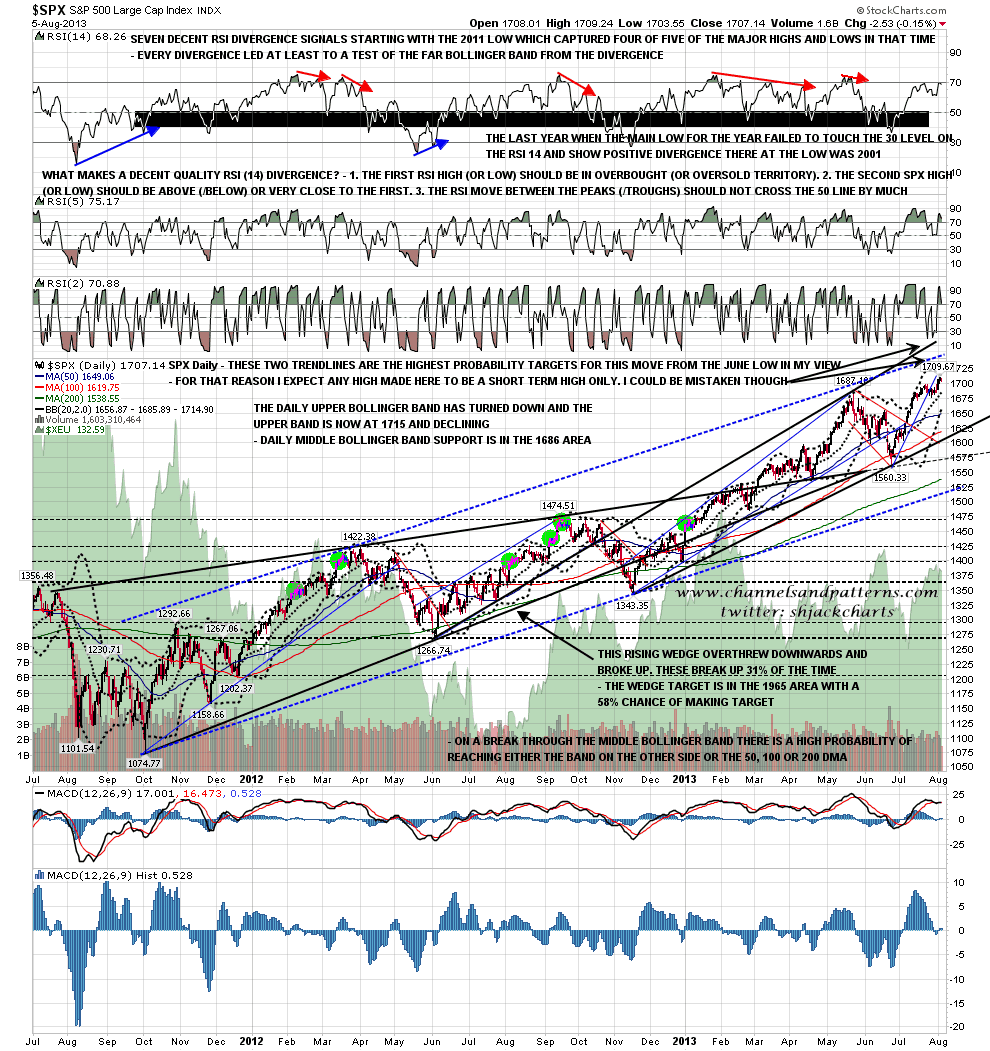
On the SPX daily chart the daily upper bollinger band is now in the 1715 area and the weekly upper bollinger band is in the 1726 area. we would be unlikely to see any weekly close this week over the 1730 area. If we see more downside first then middle bollinger band support is now in the 1686 area. SPX daily chart:
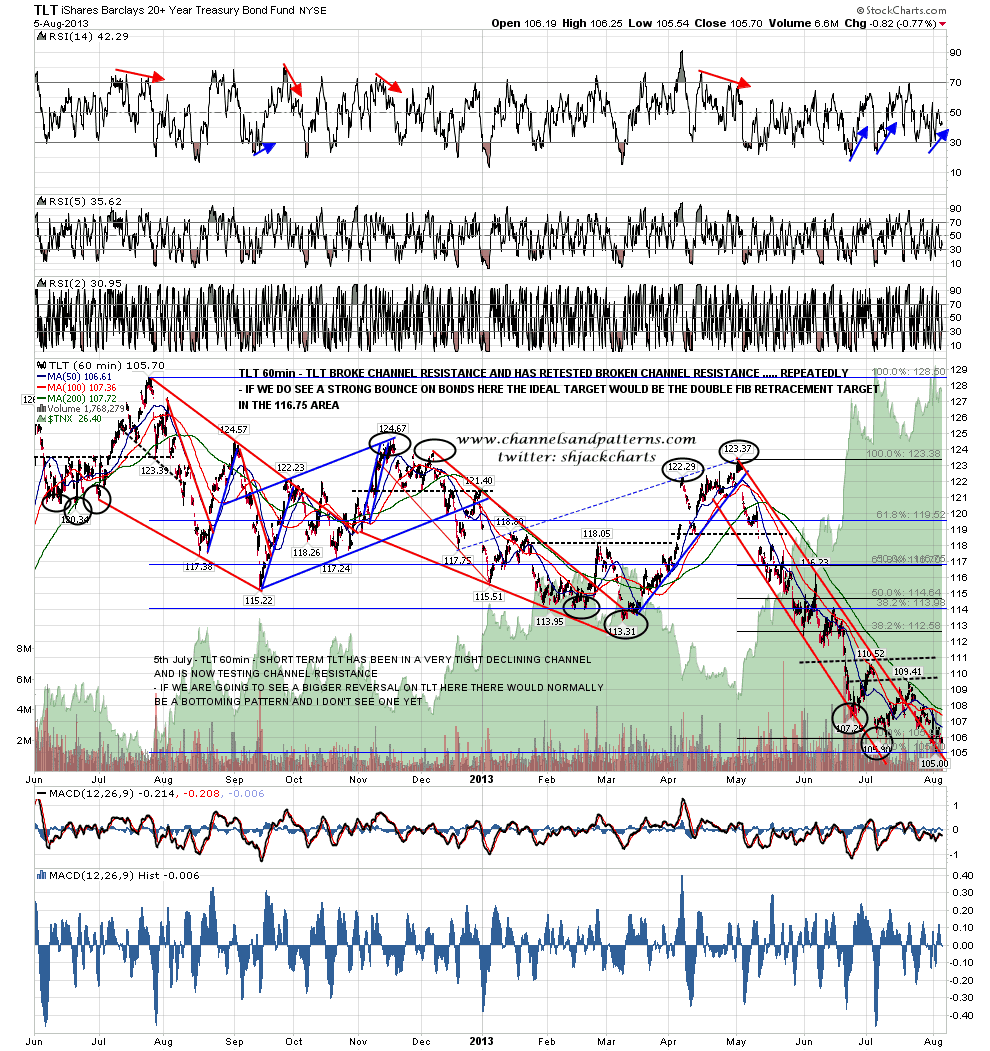
On other markets bonds still look as though they are bottoming out, even if no rally has made it far yet. If we do see a strong rally start here the last low has set up a very nice double-fibonacci retracement target in the 116.75 area on TLT. TLT 60min chart:
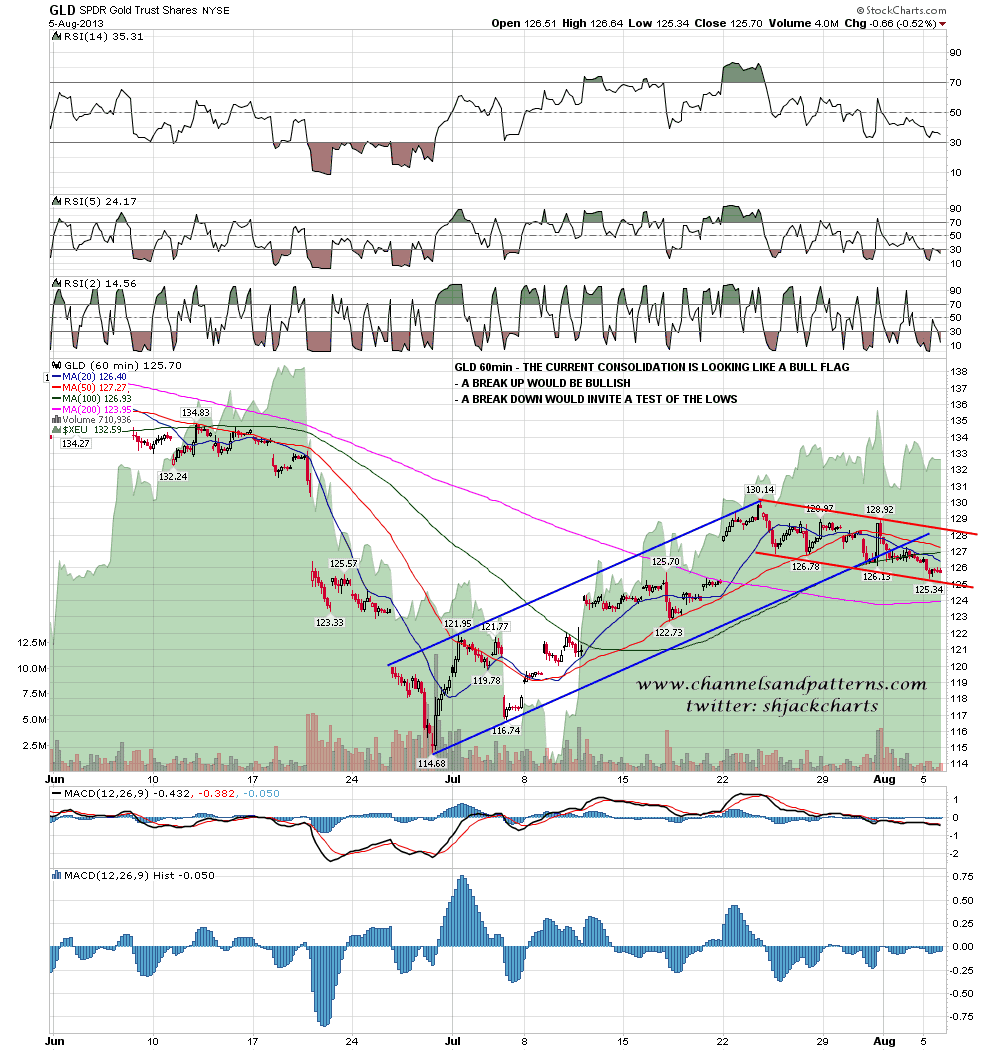
There are mixed signals on precious metals here. On gold the rising channel from the low has broken and a bull flag has been forming. A break upwards would look bullish and a break down would invite a test of the lows. Normally I would treat this as bullish, but on silver the move from the low is a large bear flag, so we may well see both break down next. I think the bear market on precious metals is over or ending, so I’d be seeing that as a buying opportunity in the making. GLD 60min chart:
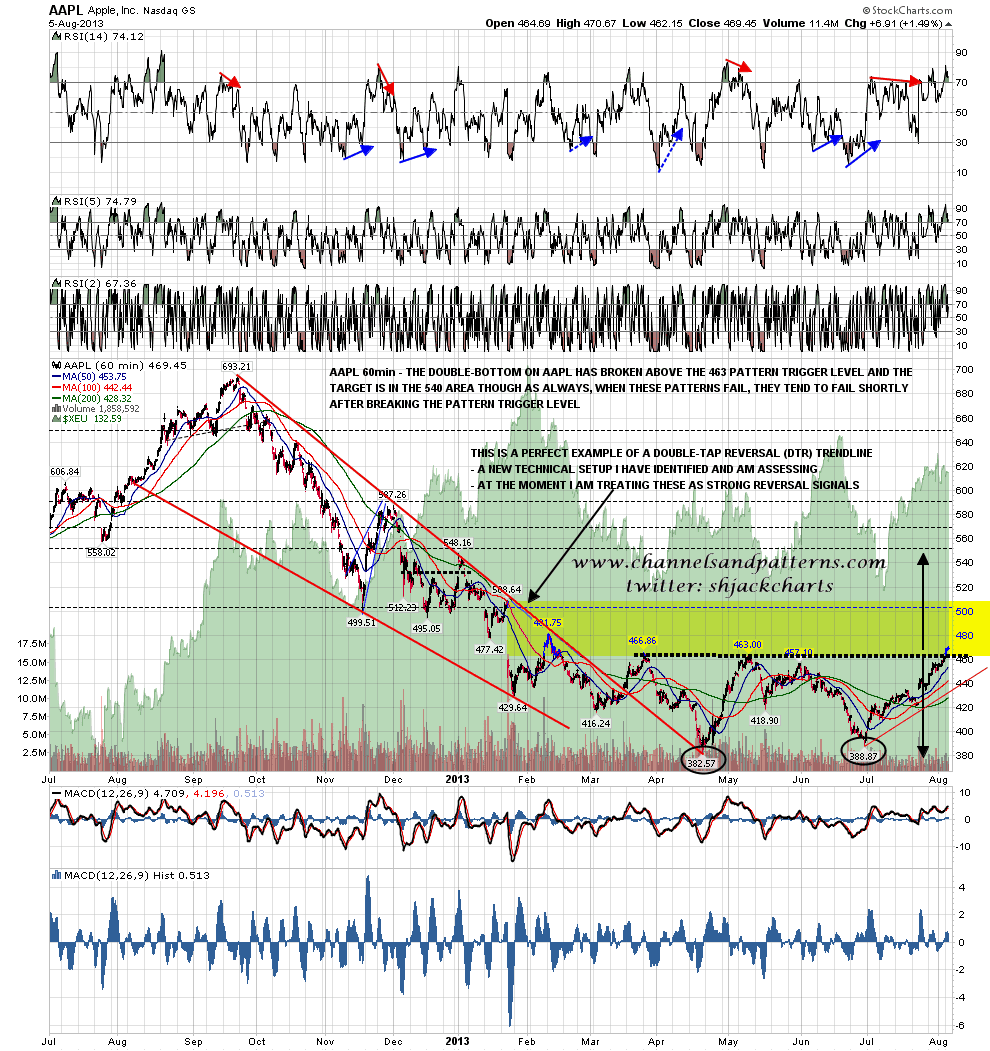
AAPL broke up through the double-bottom trigger level yesterday and the pattern target is in the 540 area. I’m expecting AAPL to make that target but it’s worth mentioning that when these patterns fail it tends to be just after the trigger level has been broken. Short term the 60min RSI is obviously also very overbought. AAPL 60min chart:
I haven’t mentioned oil today as I’m in two minds about it and need to look at it more closely. A double-top may be forming.
I have no strong feelings about direction today. Short term there is certainly some room for downside, longer term SPX has not yet reached either of my upside targets yet.
