
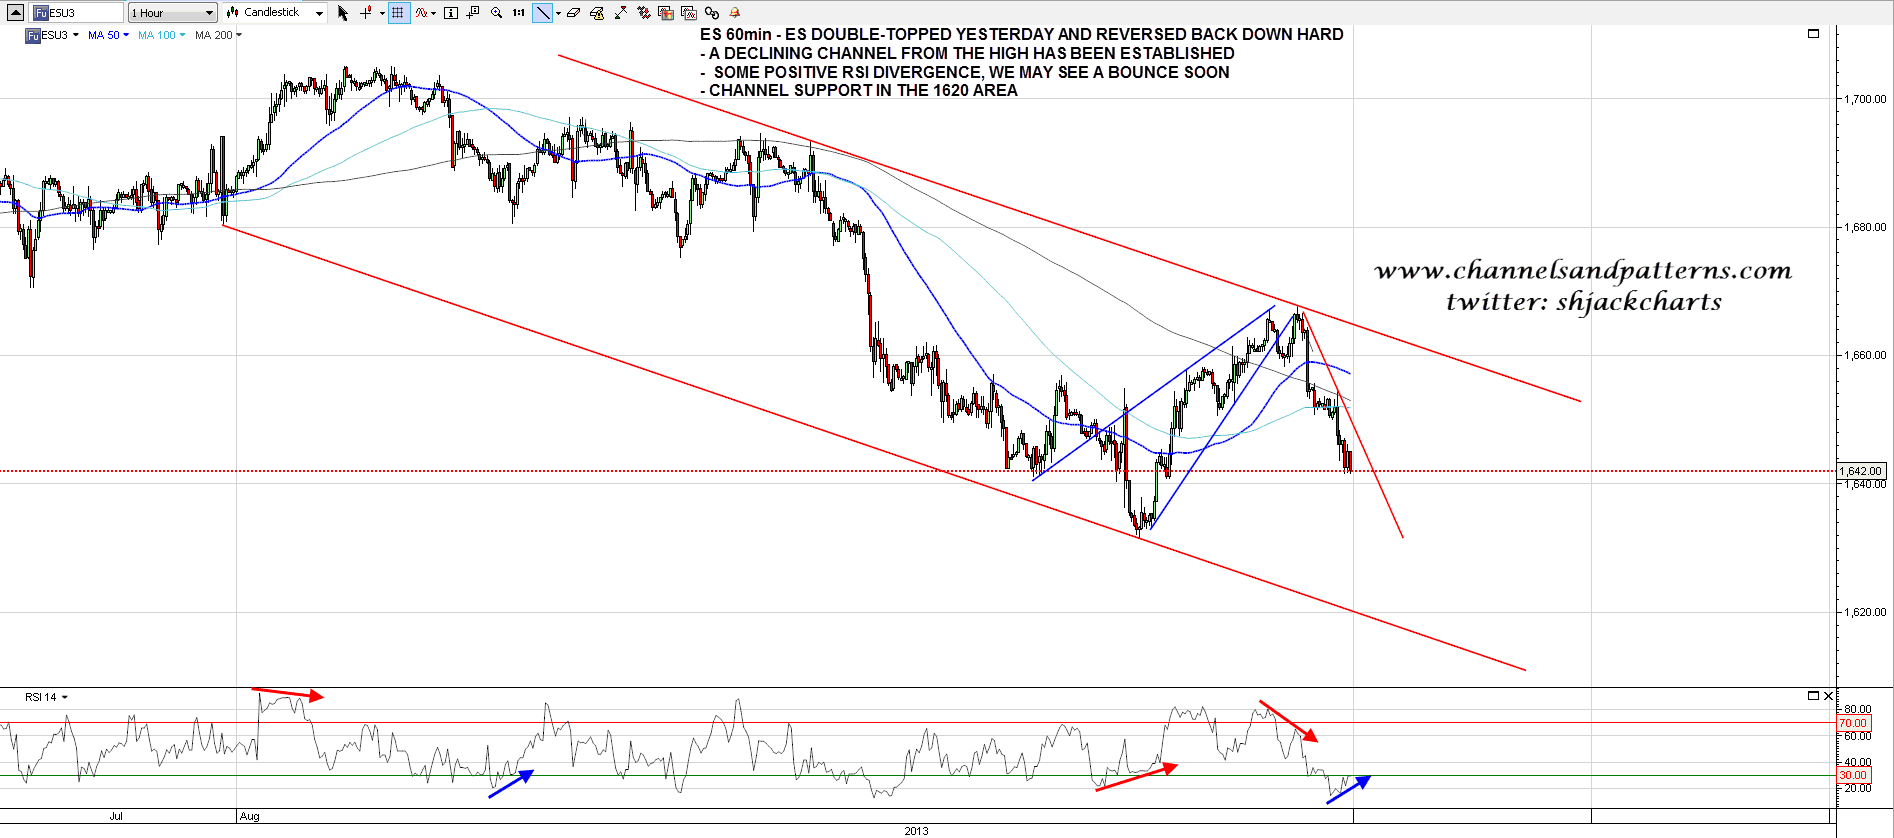
I posted on twitter last night that my rally into the 1670s scenario might well be trashed if ES broke below 1650.75. ES did and that scenario is a write-off. ES double-topped yesterday with a target at 1650 and a declining channel has now been established with channel support in the 1620 area today. There is some positive RSI divergence here and we could see a bounce. I don’t yet have a pattern for the decline from yesterday’s high. ES 60min chart:
Yesterday’s high also established a declining channel on the SPX chart. Channel support is in the 1625-30 area today. SPX 60min chart:

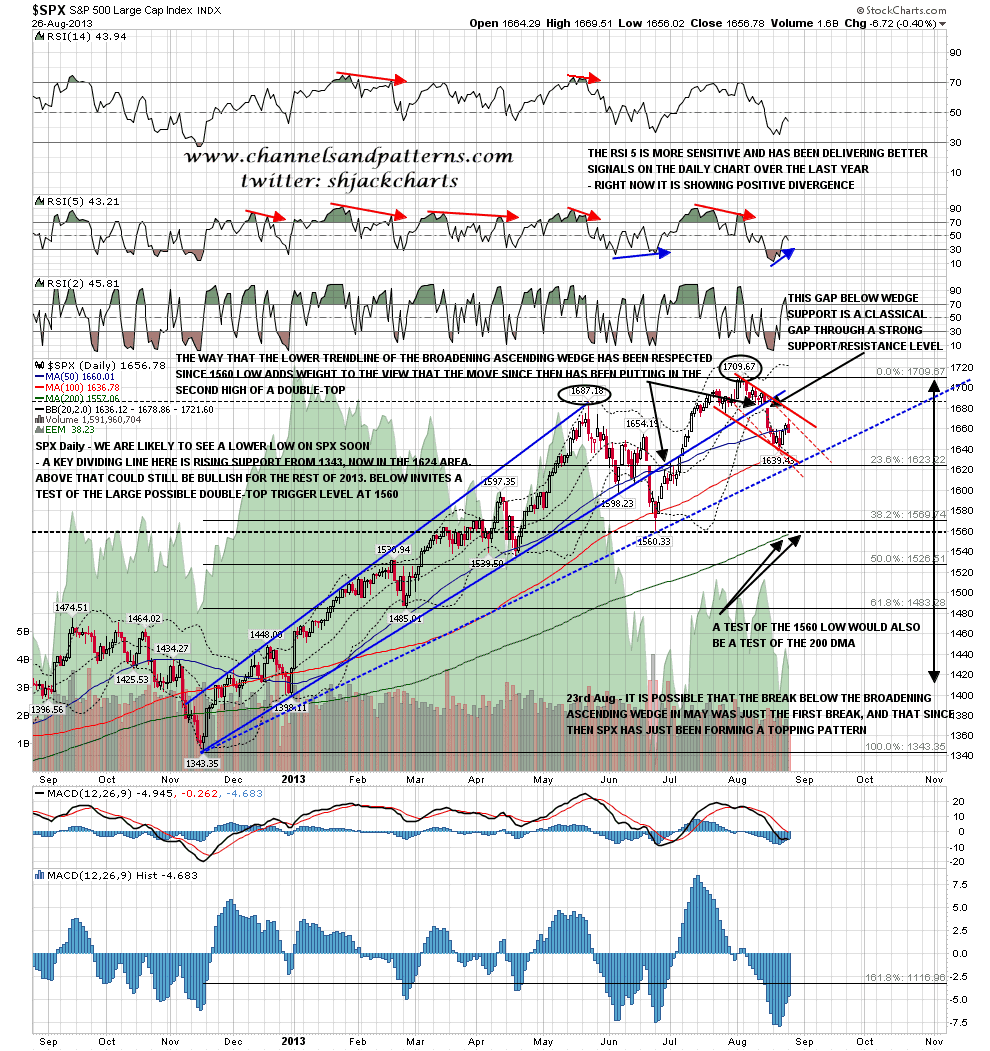
On the SPX daily There is some support at the daily lower bollinger band, which closed yesterday at 1636, but could close as low as 1628/9 today. That’s a good fit with SPX declining channel support. Just below there in the 1624 area is rising support from 1343, which is a key bull/bear line, as a clear break below would invite a test of the 1560 low. That’s obviously a decent fit with ES declining channel support today. SPX daily chart:
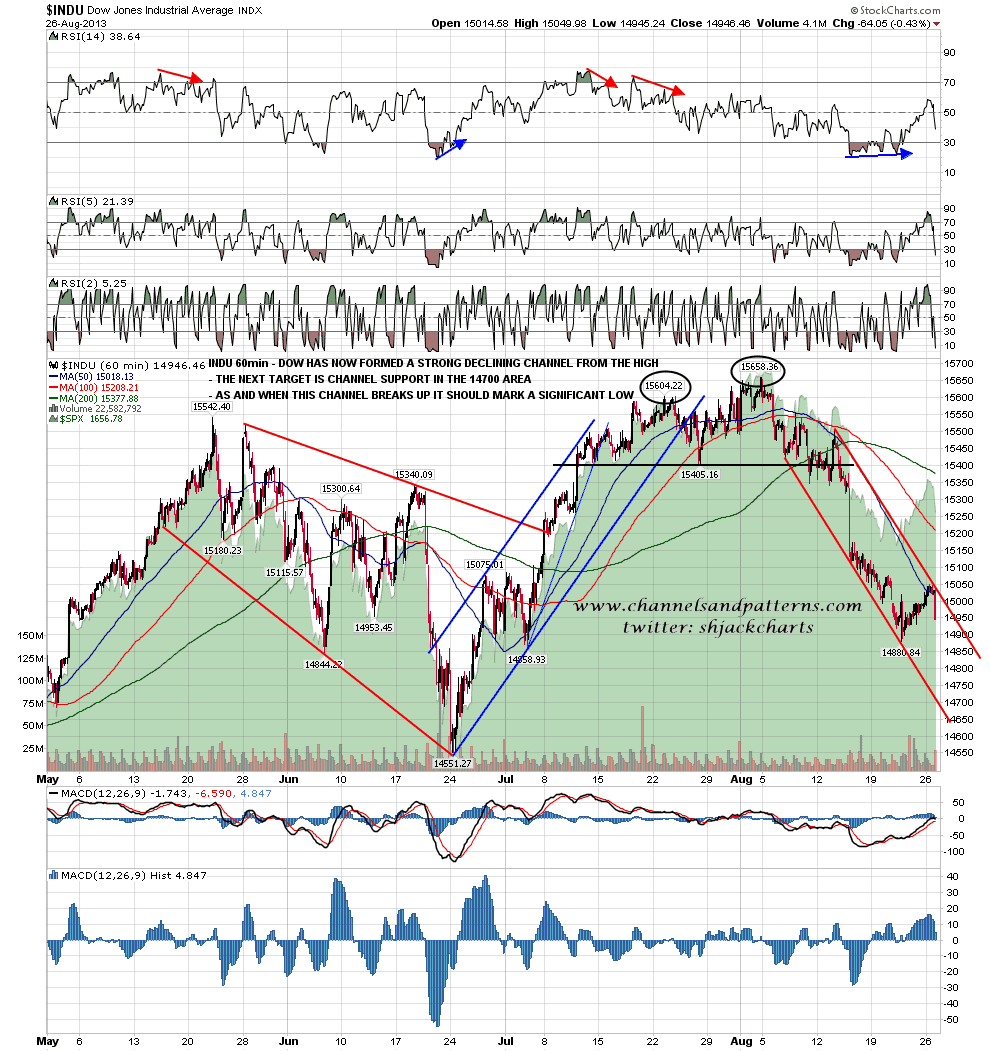
The other declining channel to be established at the high yesterday, and the strongest in terms of trendline hits, is on Dow, and that is a key channel to watch here. This is the steepest channel and I have channel support in the 14700 area today. INDU 60min channel:
I ran all of the US equity indices this morning to get a feel for this revised situation, and haven’t room to post them all today, though I’m linking to the two possible double-tops on TRAN and NDX, both of which would indicate a lot lower if they play out.
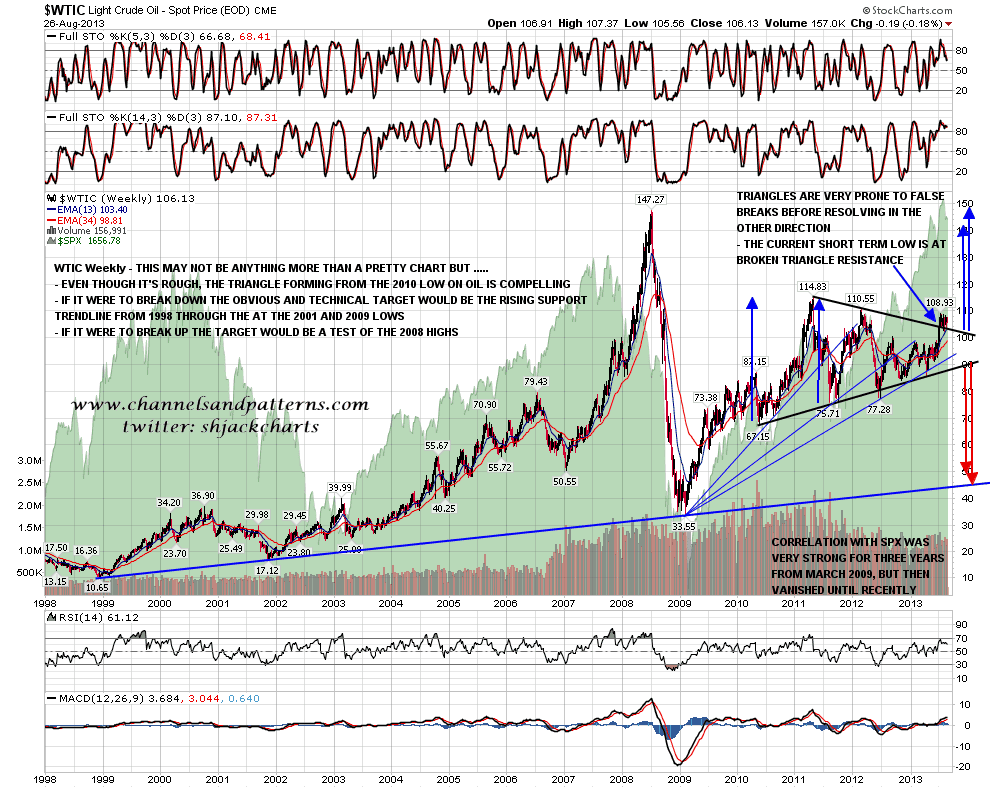
On other markets oil has broken up to a new high on news that war with Syria is increasingly likely. I’ll post my WTIC weekly chart today to remind everyone that I have a triangle there that targets the 2008 highs in the 147 area, and that the most recent low was a retest of broken triangle support. With another war in the Middle East in the air this is definitely worth bearing in mind and shorting oil could get VERY expensive over the next few weeks. WTIC weekly chart:
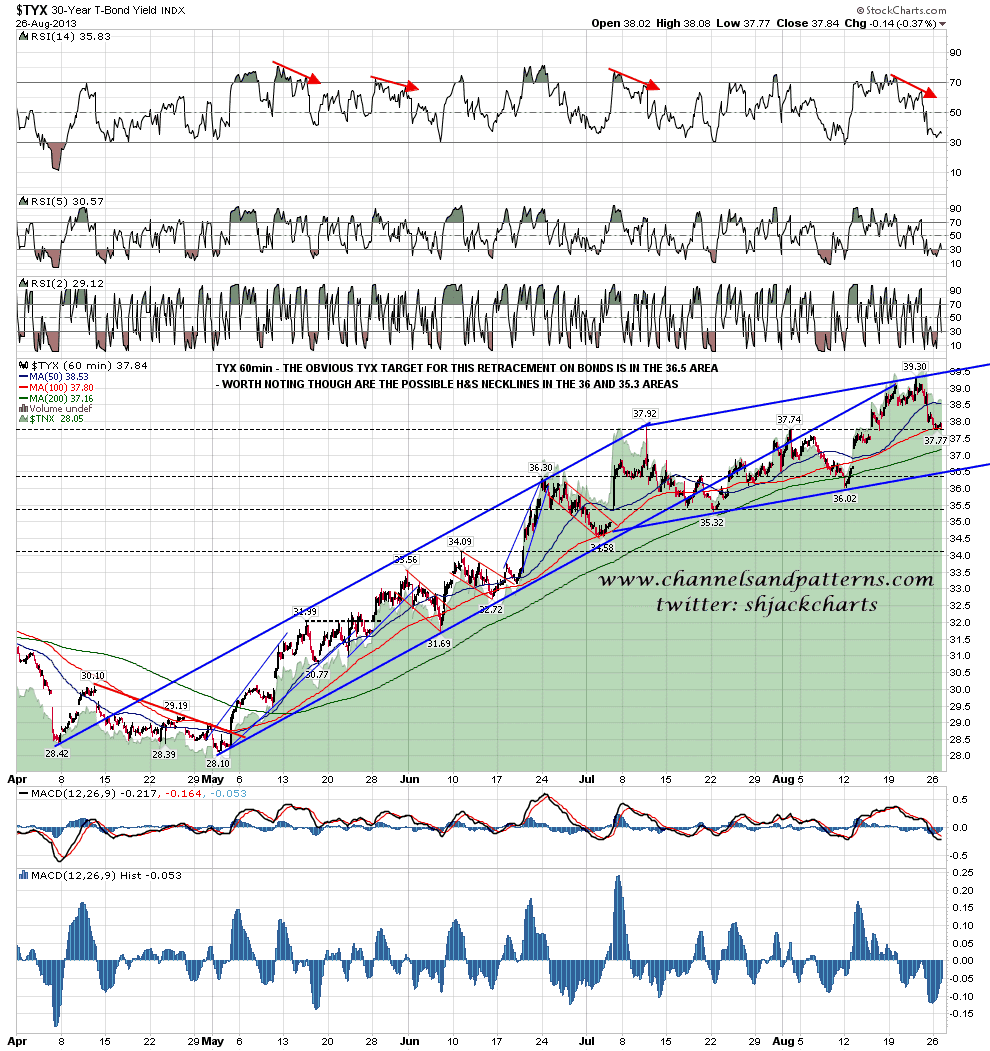
Bonds have strengthened as equities have weakened over the last day and so my rally scenario on ZB is still looking good, with the double-bottom target at 133 almost made and the declining channel target over 134 getting closer. However today I’ll post the inverse of that ZB chart on the TYX (30yr Bond Yields) chart. You can see the inverted setup there as at the close yesterday, with rising channel support in the 36.5 area looking good with ZB breaking up overnight, and possible H&S necklines in the 36 and 35.3 areas. This is just to point out that this rally on bonds may extend further than my 134 target on ZB. TYX 60min:
GBPUSD is now testing 1.55 and rising wedge support in the 1.54 area is within easy reach. I am hoping that this wedge will break down and if we are seeing a flight to safety then that may well happen as USD may be boosted with bonds. Also worth noting here is the possible H&S neckline in the 1.542 area. GBPUSD 60min chart:

I’m expecting to see a test of SPX declining channel support in the 1628-30 area and that may well happen this morning. There is also decent SPX support in the 1618-20 area, with rising support from 1343 at 1624/5 this morning. If positive RSI divergence on ES holds into this support area then we may well see a decent rally from there, and possibly a retracement low.
