
I’m not keen on FOMC days, and even by usual standards yesterday’s FOMC action was pretty wild, which was odd as essentially nothing new was revealed. On the wild spike up after after the first spike down the declining channel on SPX was broken and I posted a very nice technical rally scenario on twitter. Even after the next wild spike down yesterday that is still very much in play as long as yesterday’s low area holds, and so here is that chart that I posted then. SPX 60min chart:
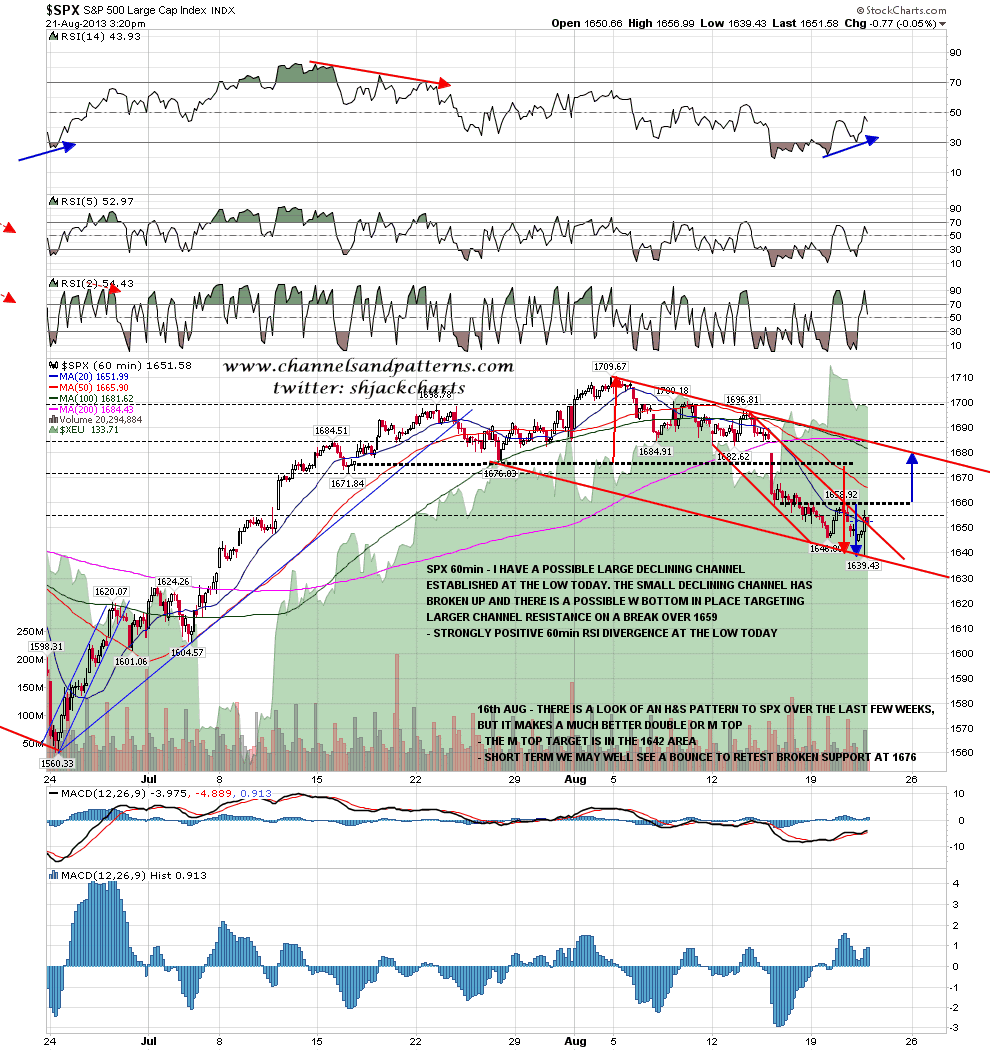
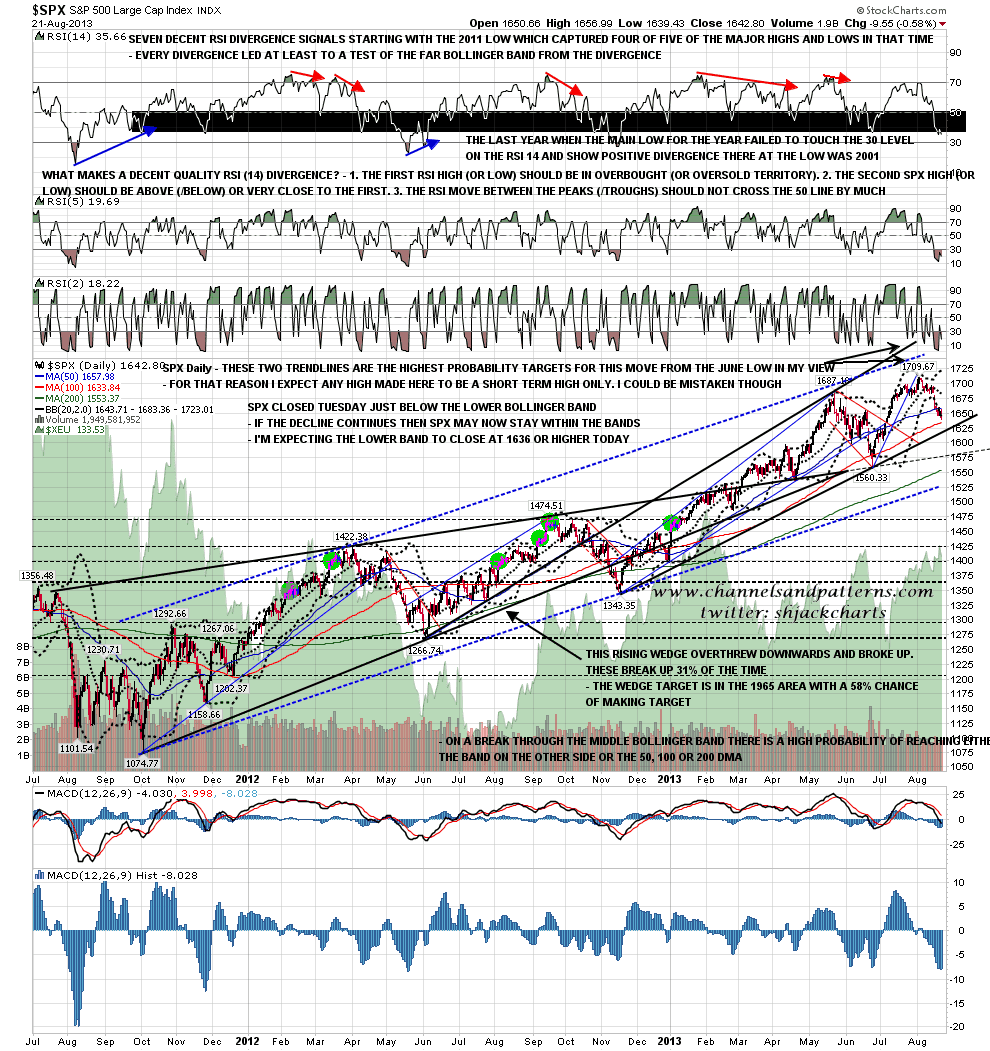
I was talking yesterday morning about the possibility that SPX might well stay within or very close to the bollinger bands after the recovery back into the bands on Tuesday. That is happening so far with the close yesterday at 1642 less than a point below the lower bollinger band. The lower bollinger band should close at 1636 or higher today so if the decline continues then that is the target closing range. If we see the rally scenario on the chart above play out then obvious resistance is at the daily middle bollinger band, currently at 1683 and therefore a good fit with that scenario. SPX daily chart:
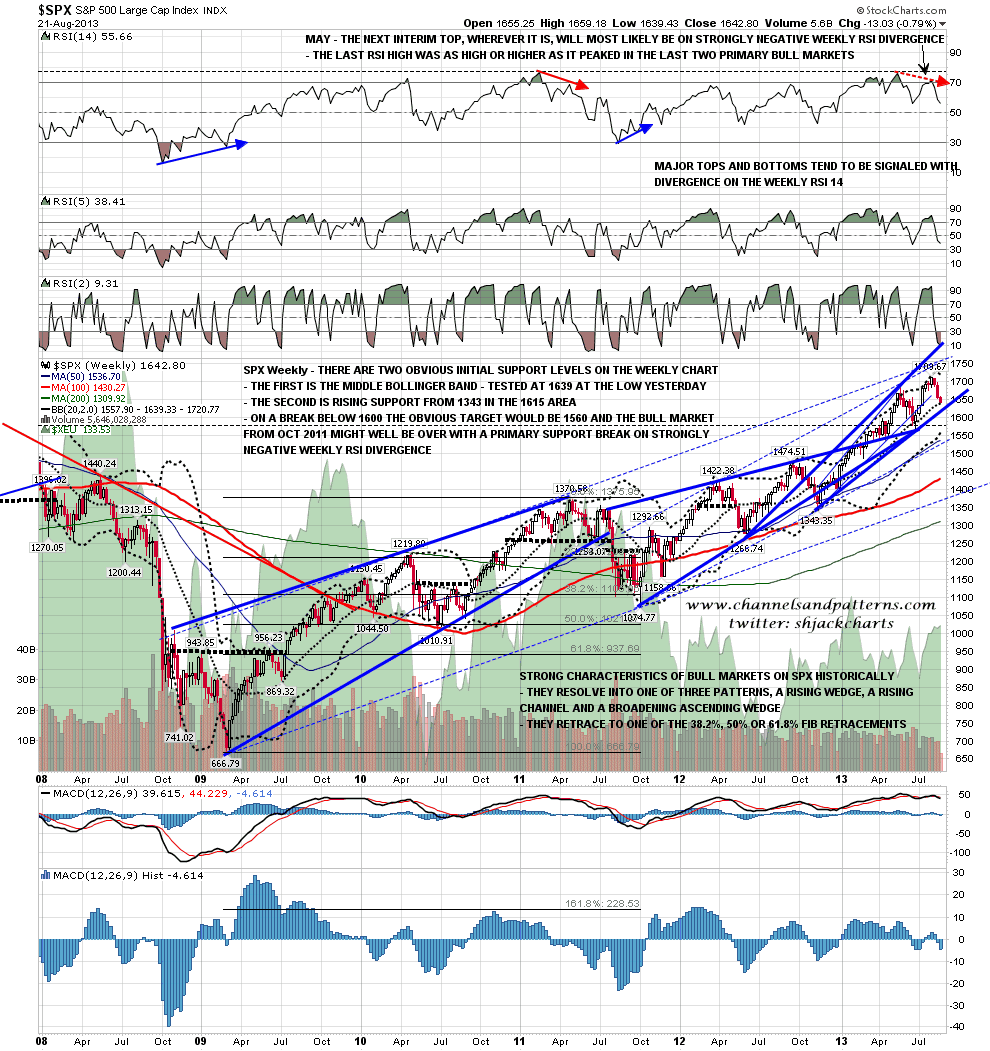
When I gave downside targets a few days ago I gave the double-top target at 1642, and that has been made. I also gave the 50% fib retracement level and the weekly middle bollinger bands at 1635, and while 1635 has not been hit, the weekly middle bollinger band was tested yesterday at 1639. If the downtrend continues today that leaves the remaining targets and support levels I gave then as the 50% fib retracement at 1635 SPX and the 100 DMA at 1630. SPX weekly chart:
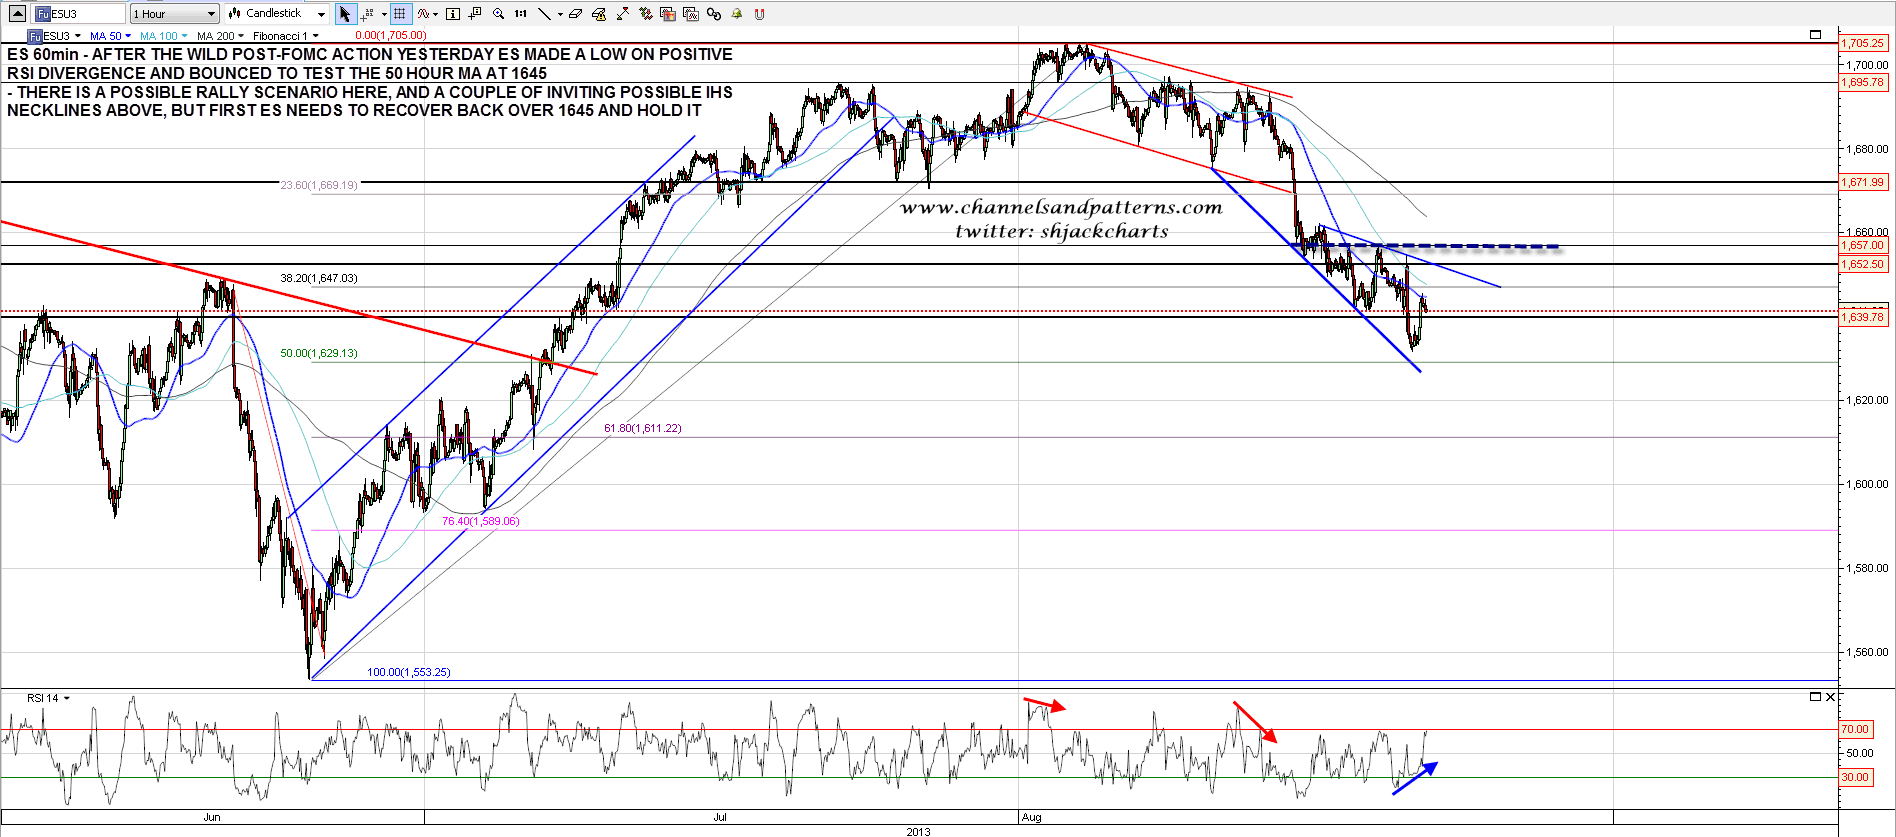
ES had a wild night, getting as low as 1631.50 before rallying on strongly positive RSI divergence. So far that rally has failed at the 50 hour MA at 1645, though ES appear to be forming a bull flag below that at the moment. If ES can break above it then strong resistance and possible IHS necklines are in the 1655-7 area on ES. ES 60min chart:
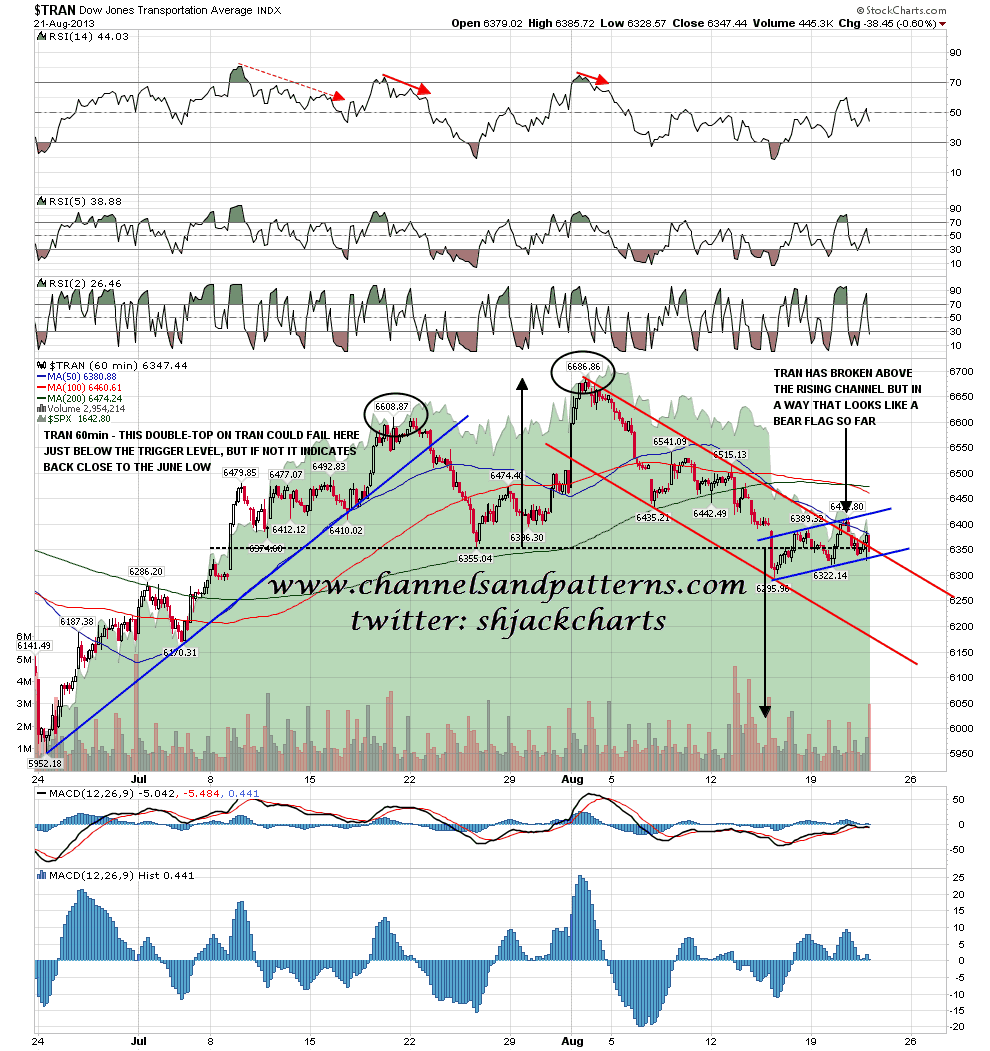
I was saying yesterday morning that TRAN had broken above the declining channel there, but so far looked as though a bear flag was forming. That still looks like a bear flag this morning, so mixed signals there. TRAN 60min chart:
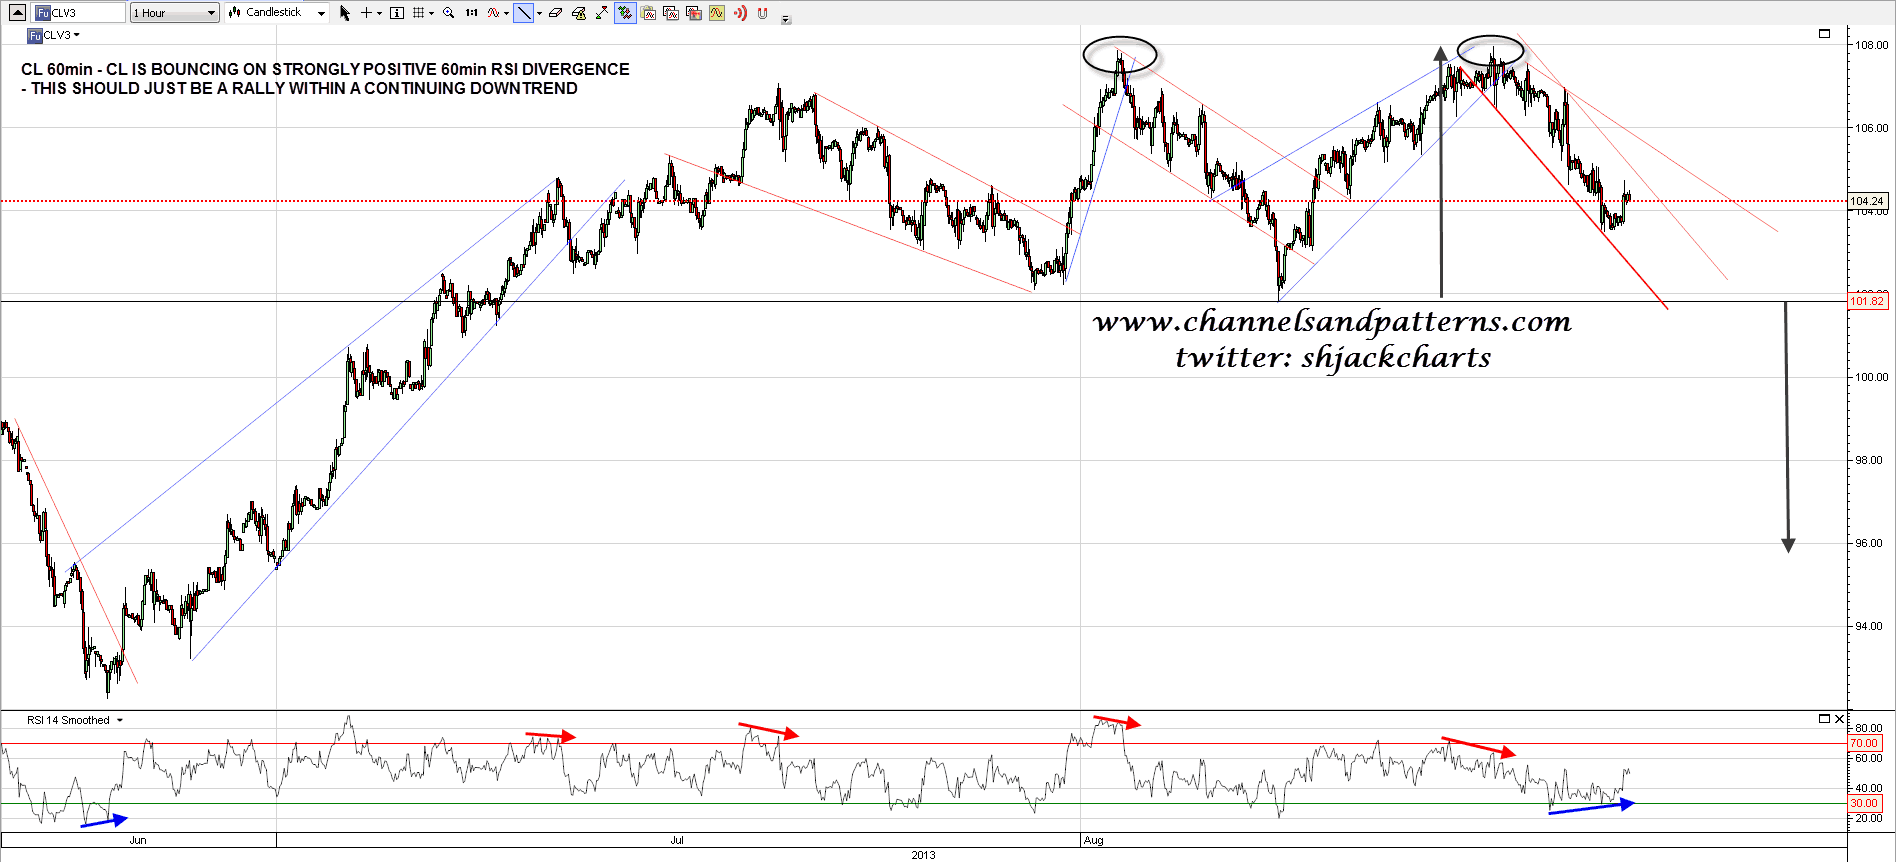
On other markets CL is bouncing on strongly positive RSI divergence. I’m expecting this to be a rally within an overall downtrend and have drawn a couple of possible trendline targets on the chart. CL 60min chart:
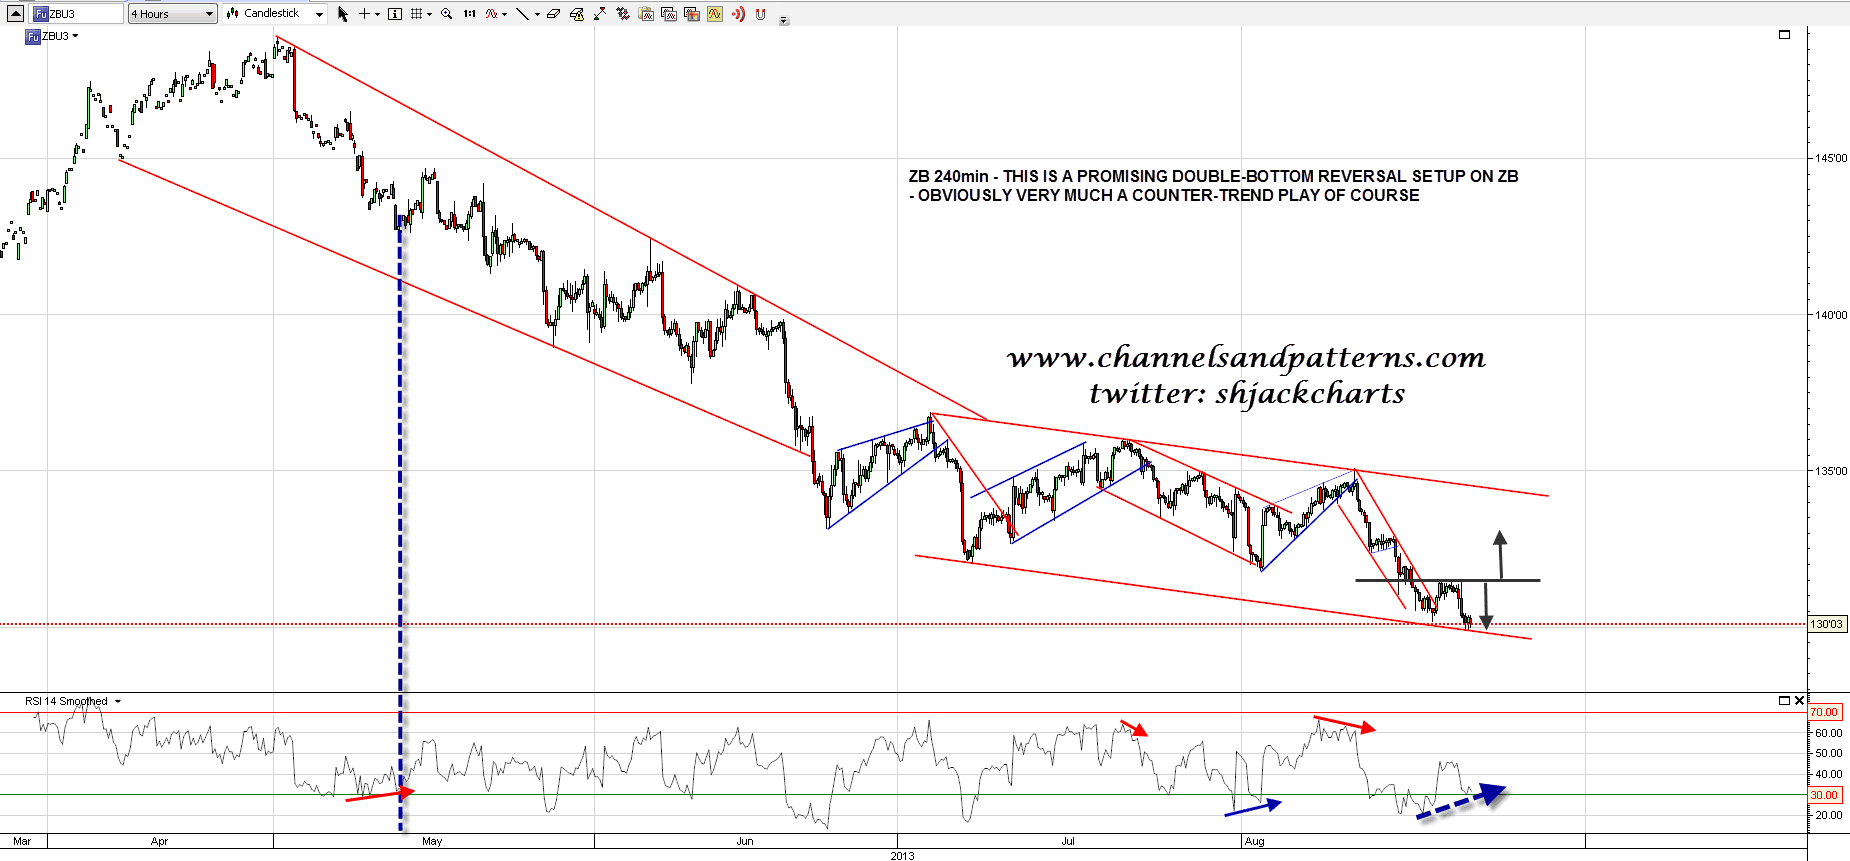
ZB broke down yesterday and so far has made the double-bottom that I was talking about as a possibility yesterday morning. I have shown this on the 4 hour chart below and this is an attractive rally setup, though obviously counter-trend in a long decline that I don’t think is bottoming out yet. ZB needs to hold that channel support trendline just below on an hourly close basis. ZB 240min chart:
GBPUSD pinocchioed rising wedge resistance slightly at the (post-FOMC) high yesterday and then reversed downwards hard (at last). The obvious target is rising wedge support, now in the 1.534 area, and if the USD uptrend is to resume that rising wedge will need to break down at some point. GBPUSD 60min chart:

One thing that has been very obvious over the last few days is that SPX and bonds have been positively correlated. Therefore the rally scenarios here on SPX and ZB are linked, and they will most likely either both succeed or both fail. I’m leaning towards both being successful here but it could go the other way. The hard failure at 1655 ES yesterday showed how little confidence the bulls have here at the moment.
