
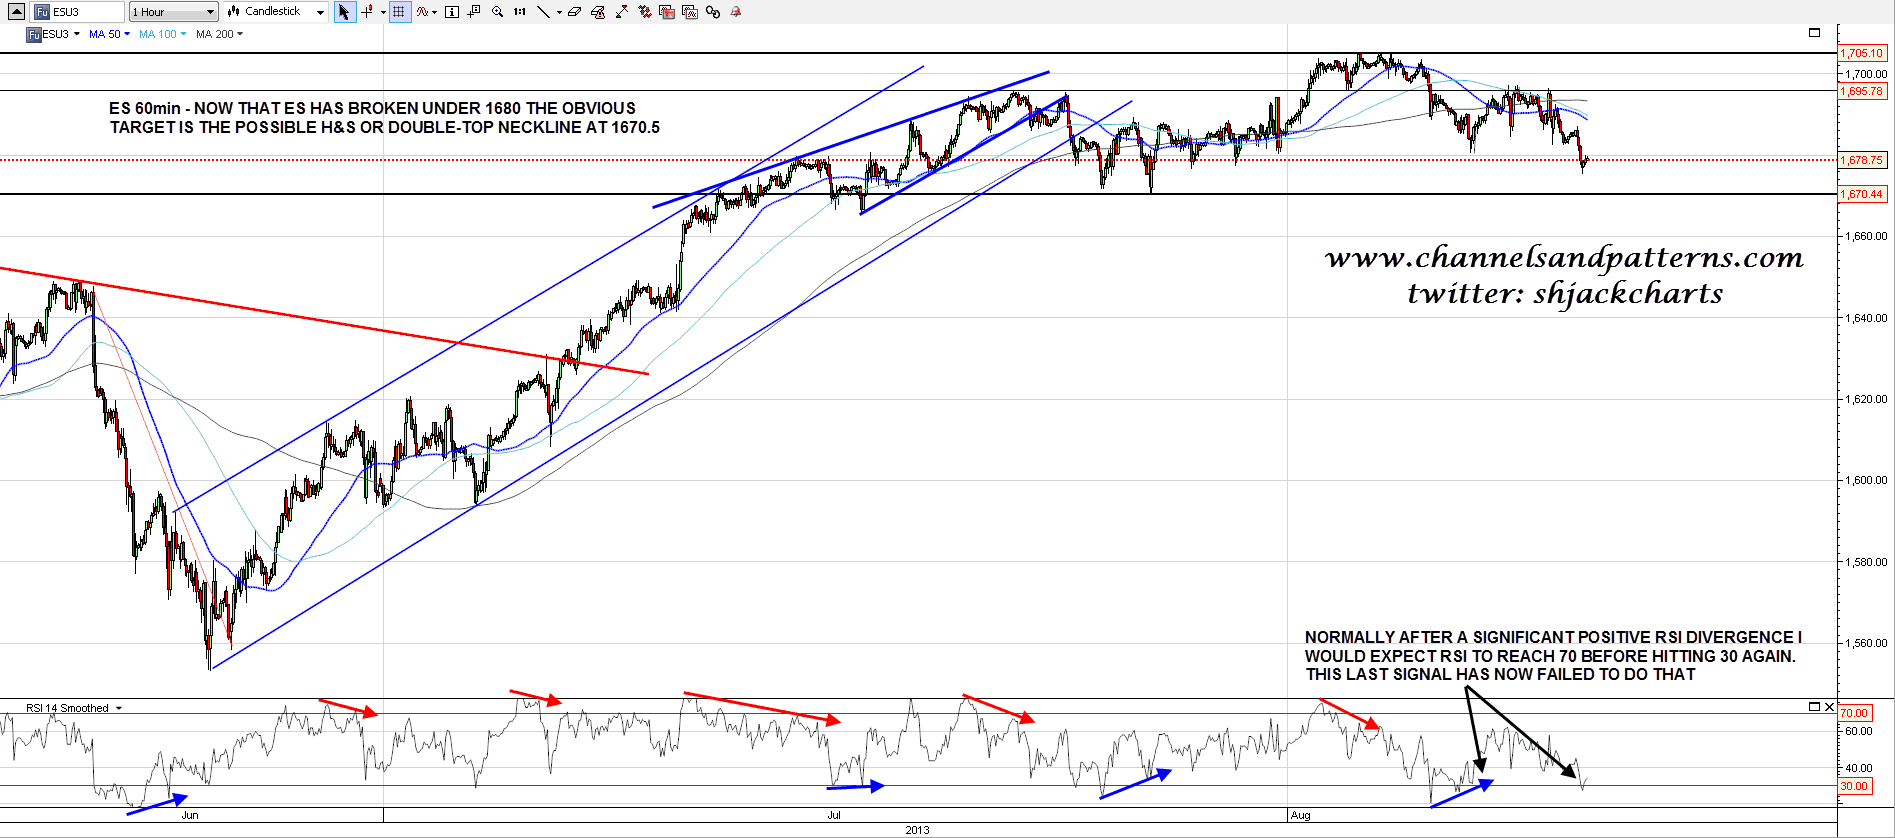
ES broke under 1680 support overnight and the obvious next target is the possible H&S and double-top neckline at 1670.5. The last positive RSI divergence that I was looking at on Friday morning on the basis that these would usually reach the 70 level on RSI has failed to do so as the 30 level on RSI has hit overnight instead. ES 60min chart:
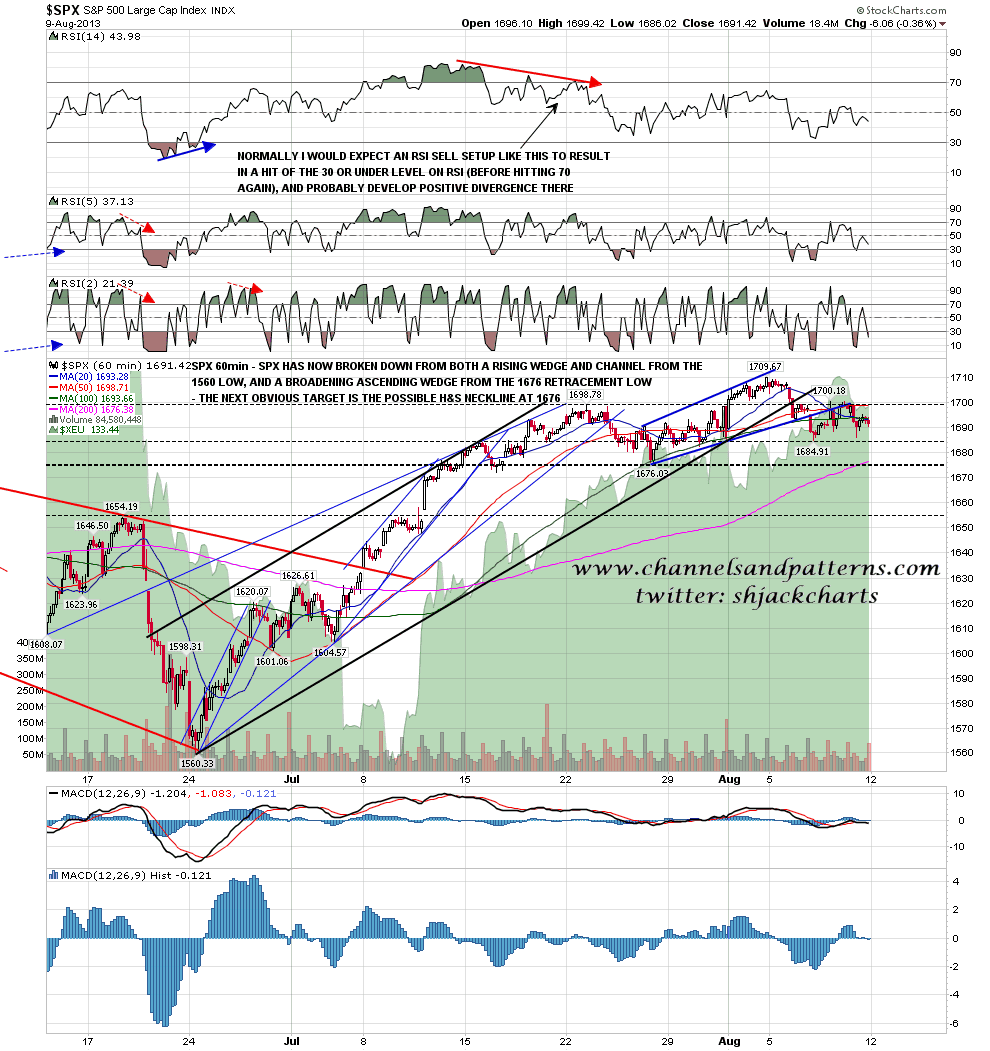
That possible H&S (and double-top) neckline on SPX is at 1676, and that is higher now than the ES target as these move together at about 2 points per month over the three month ES contracts. As in the case of conflicts like these the SPX target is generally the correct one, that puts the target at 1676 SPX and 1672 ES. SPX 60min chart:
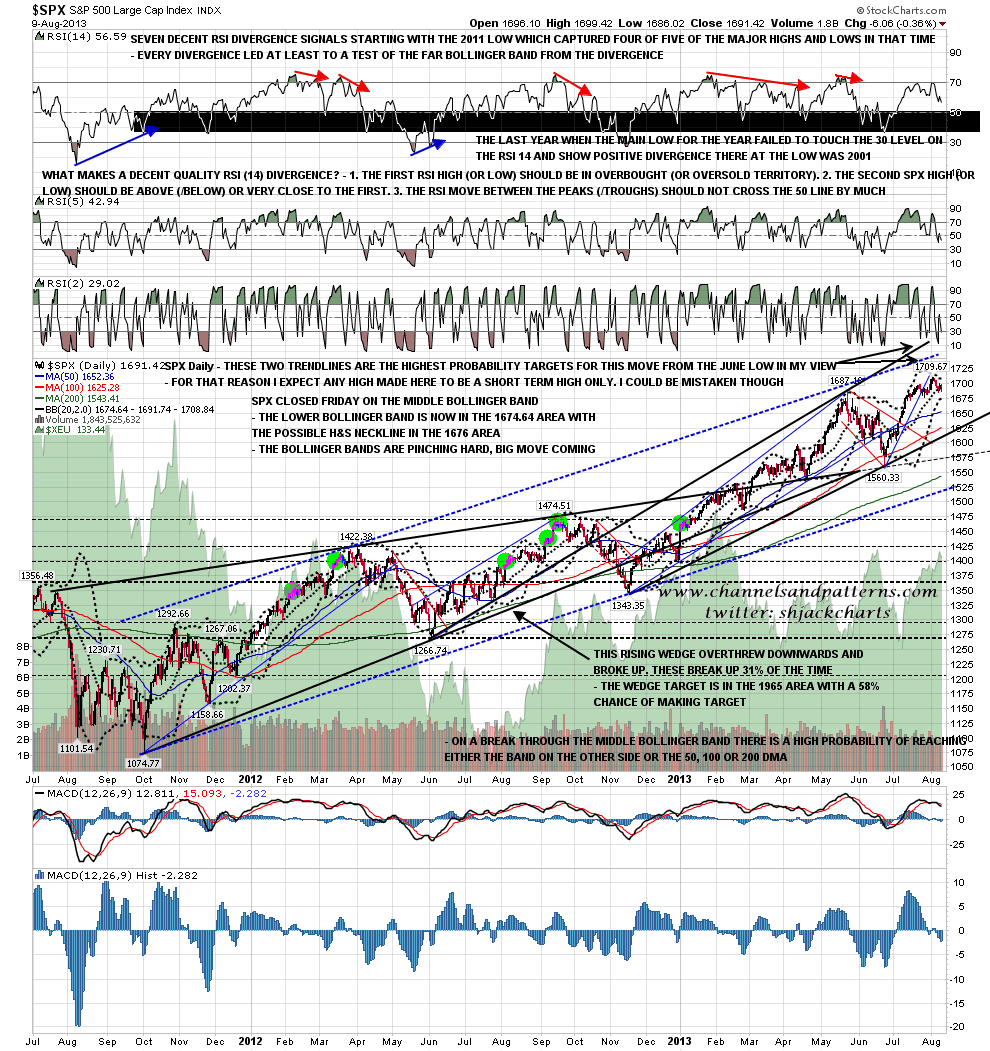
Obviously if the 1676 level turns out to be an H&S neckline I would expect a strong bounce there to form the right shoulder. There is good support for that possible test and bounce on the SPX daily chart where the daily lower bollinger band is now at 1674.64. SPX daily chart:
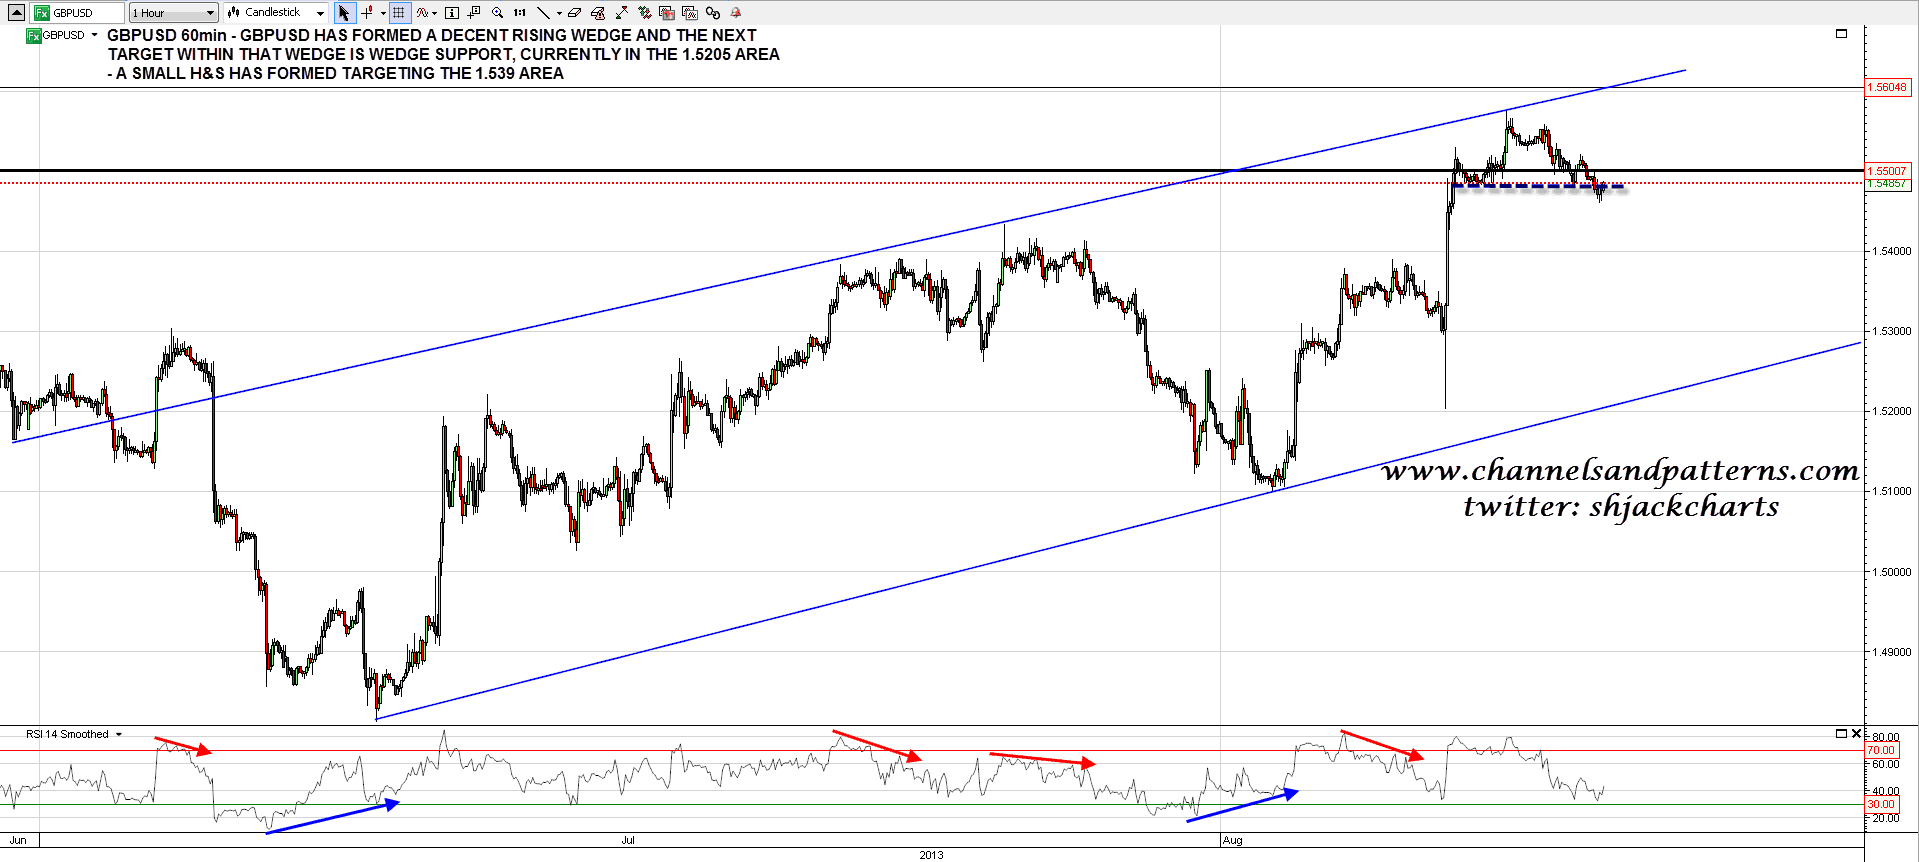
On other markets I posted the rising wedge on GBPUSD on Friday with the comment that the obvious target was at wedge support in the 1.52 area. Since then an H&S has formed and is breaking down with a target in the 1.539 area. GBPUSD 60min chart:
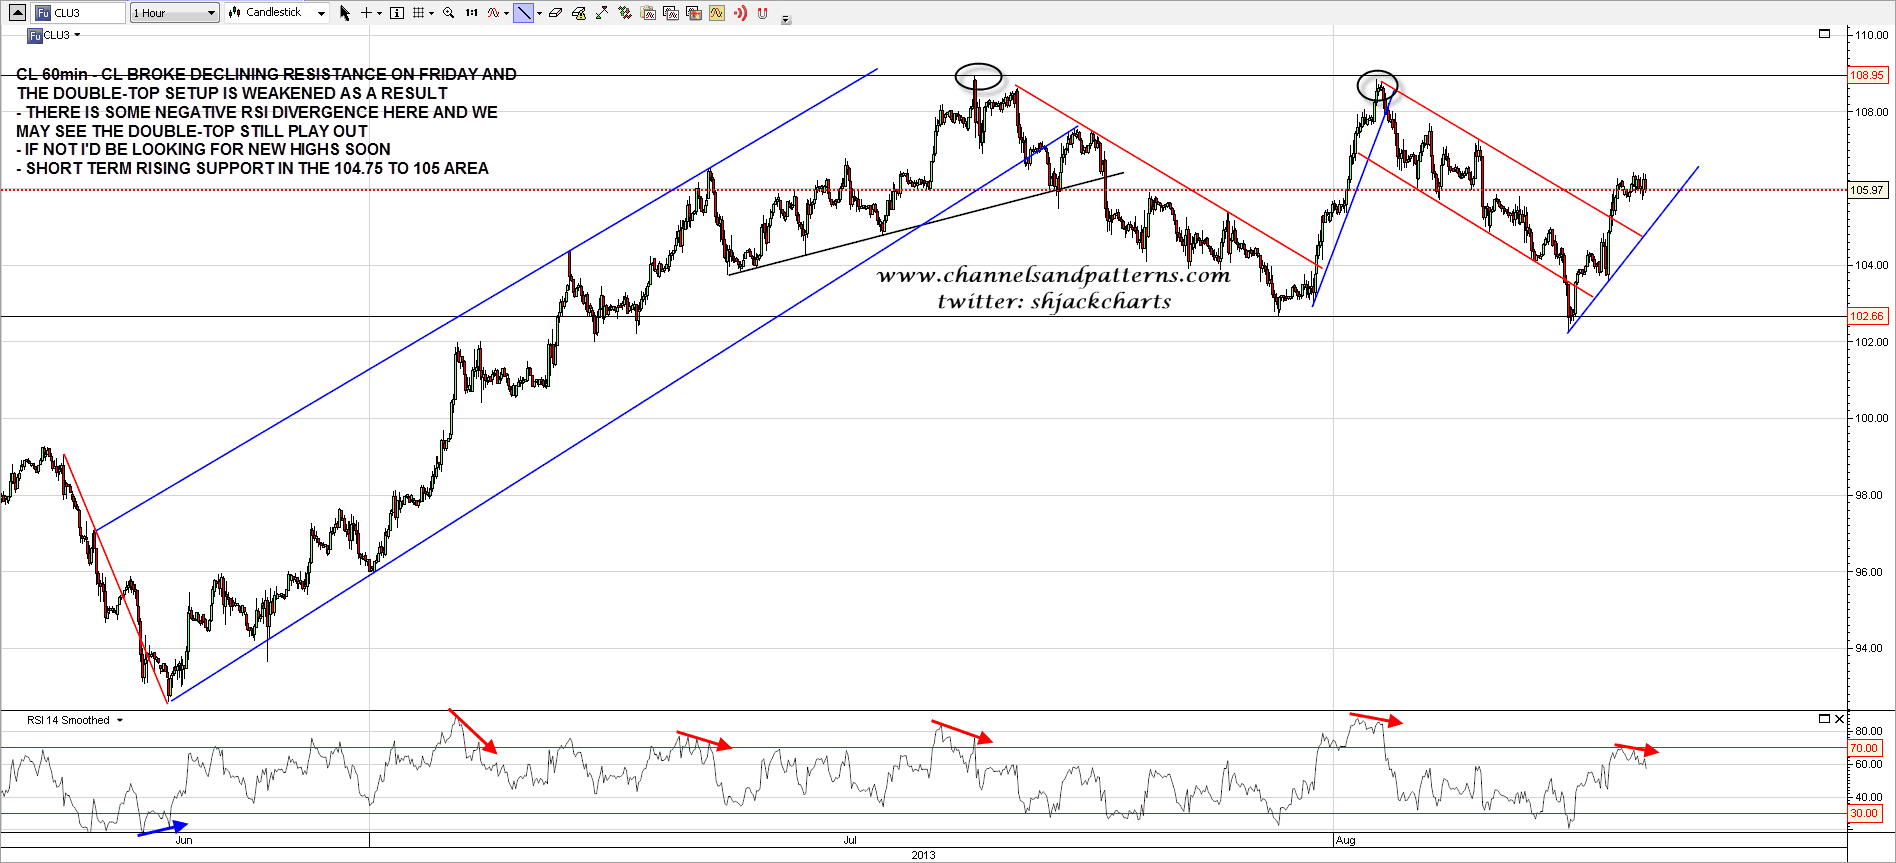
The double-top on CL is in trouble as CL broke over declining resistance on Friday. There is short term negative RSI divergence and the double-top may still have a shot, but with the cautionary notes that CL reached the level where these patterns fail when they fail, and that if it fails I would expect new highs not too long afterwards. CL 60min:
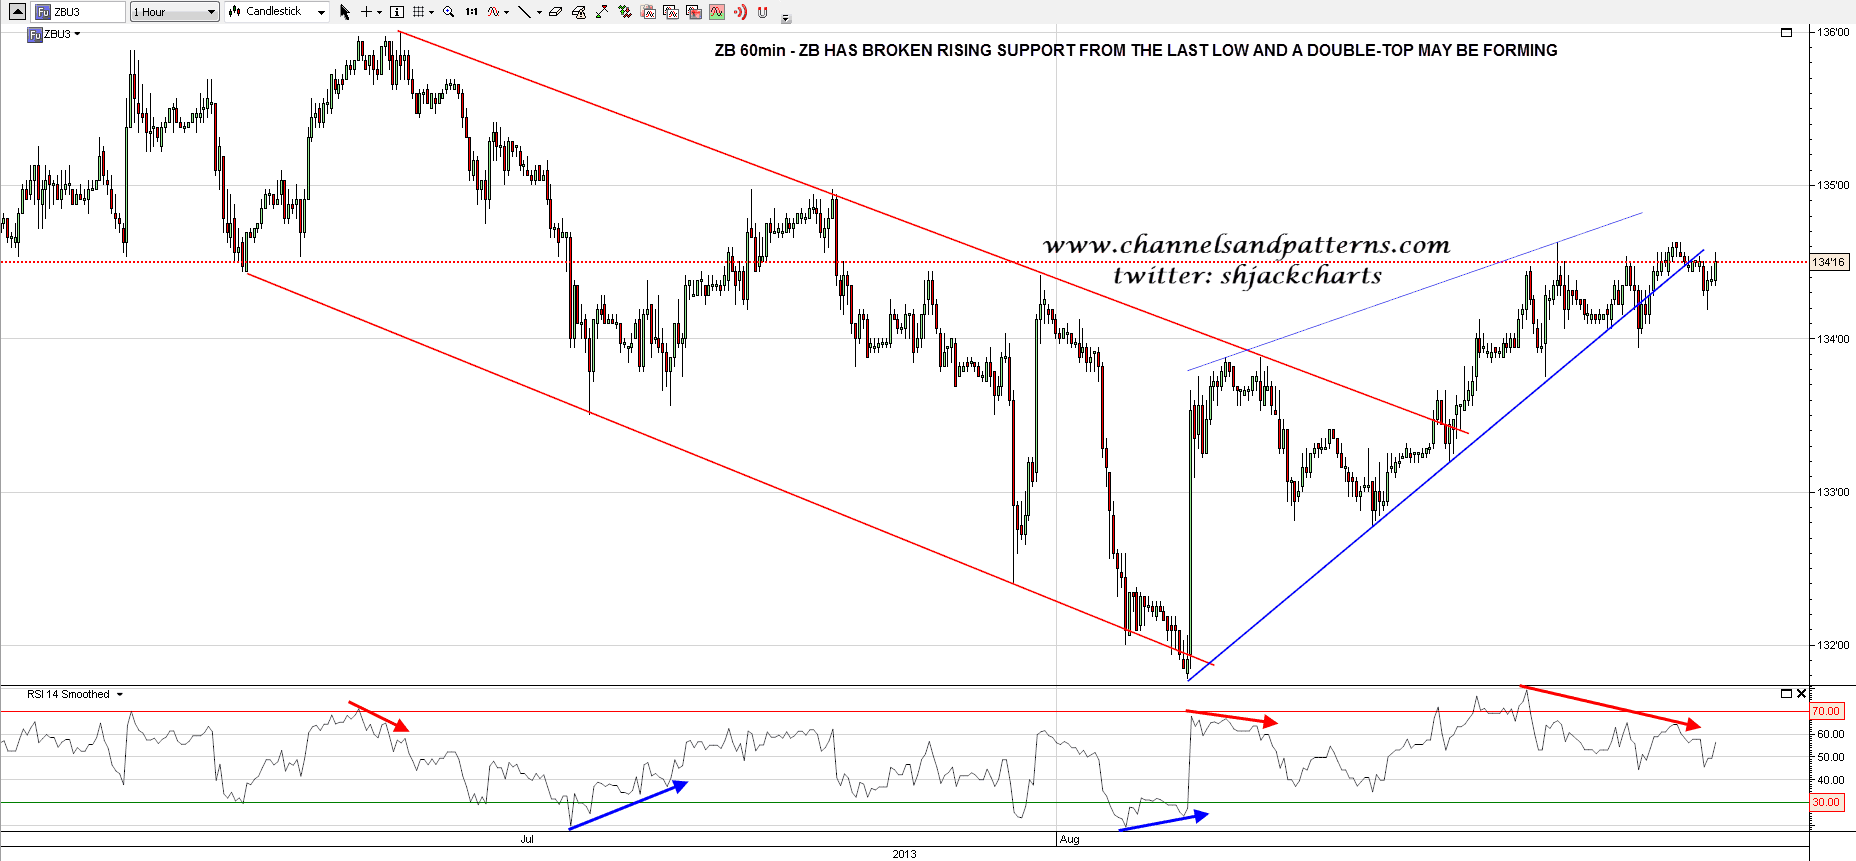
On bonds ZB has broken below short term rising support on negative RSI divergence and a short term double-top may well be forming. ZB 60min chart:
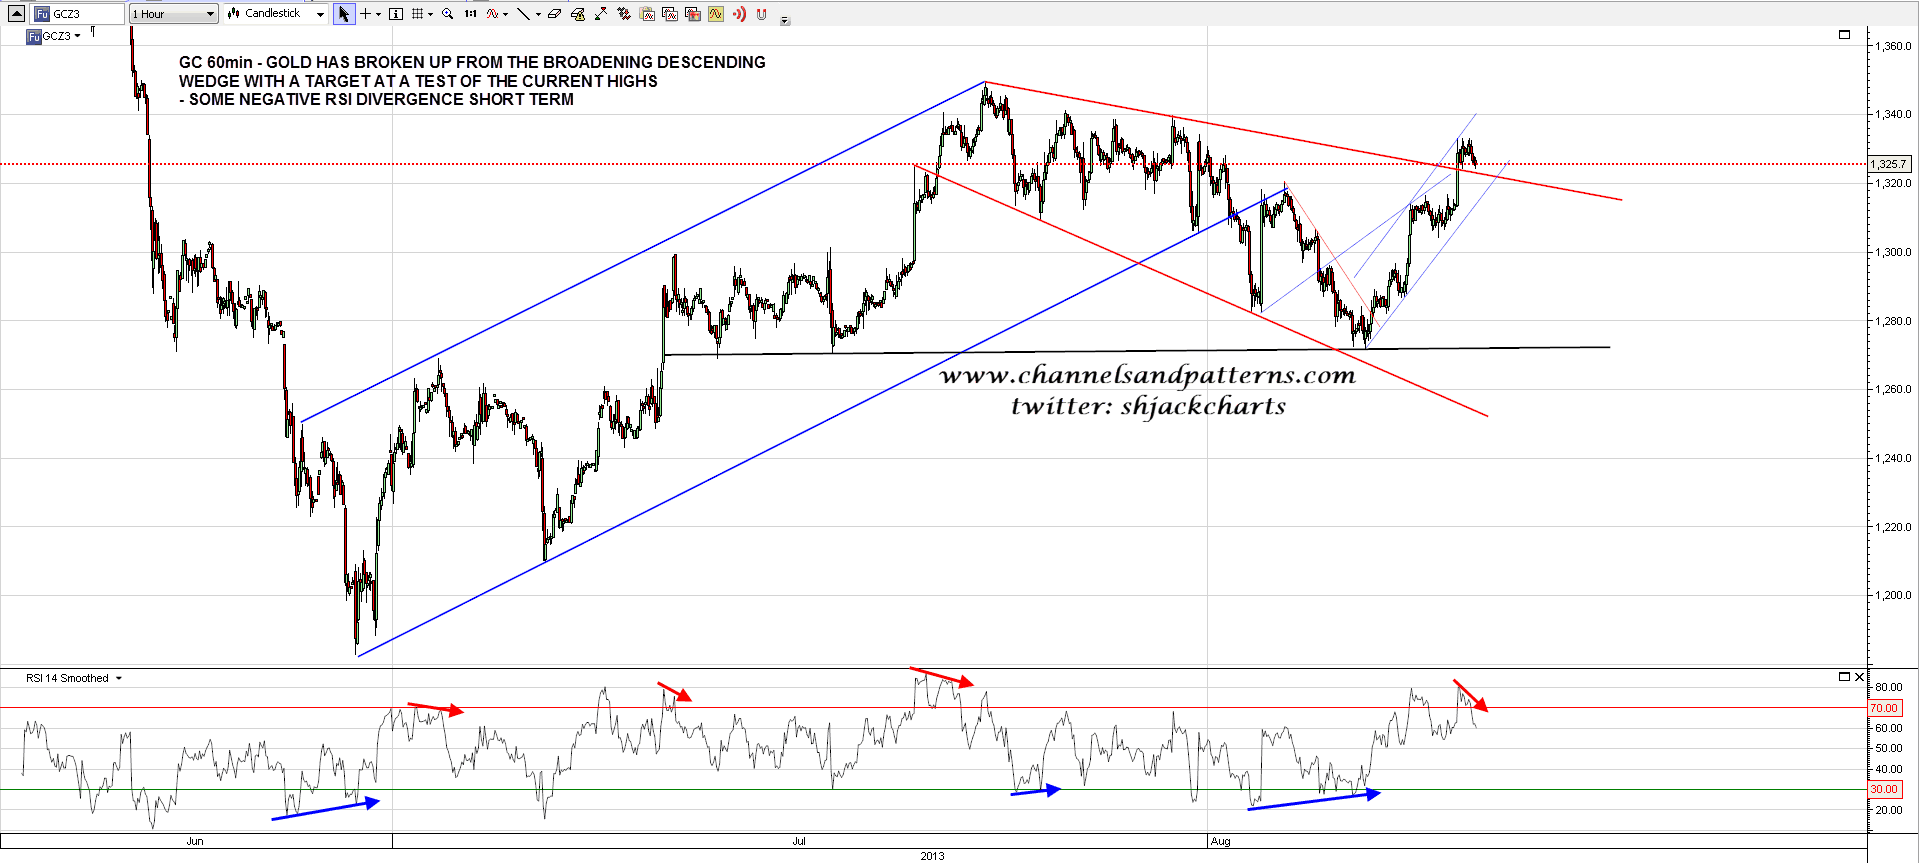
Lastly gold broke up from the broadening descending wedge formed in recent days and the target is a test of the current rally high. There is some negative RSI divergence but that may be an early part of a larger divergence forming at that test. GC 60min chart:
I’m leaning bearish today, though we may well see the opening gap fill before a move to test the possible H&S neckline at primary support level in the 1676 SPX area.
