
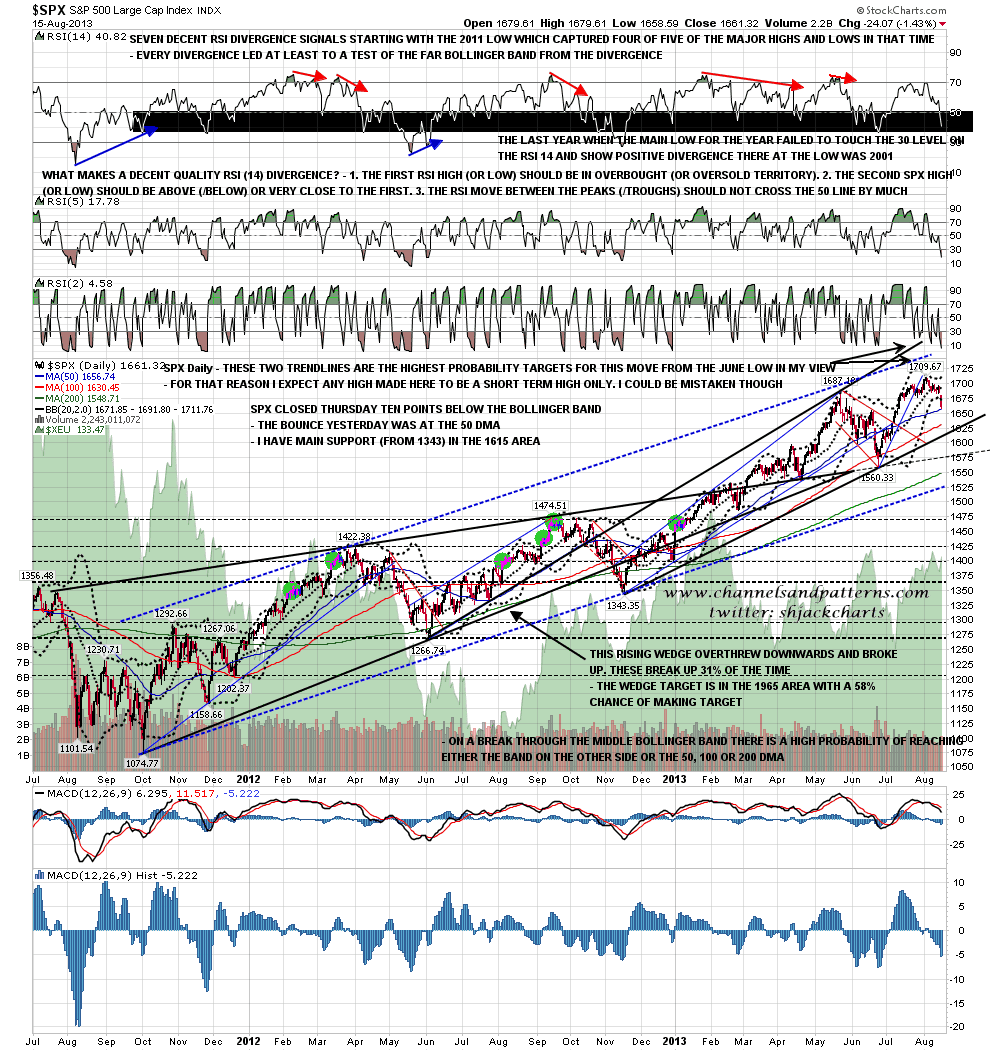
Yesterday was a trend day and the odds favor a day or two of retracement or consolidation afterwards. SPX also closed a clear ten points below the daily lower bollinger band, and while it is easier for SPX to trade well below the lower band in a strong downtrend than it is for it to trade well above the upper band in an uptrend, it still has some magnetic pull. We may well retrace or consolidate today. SPX daily chart:
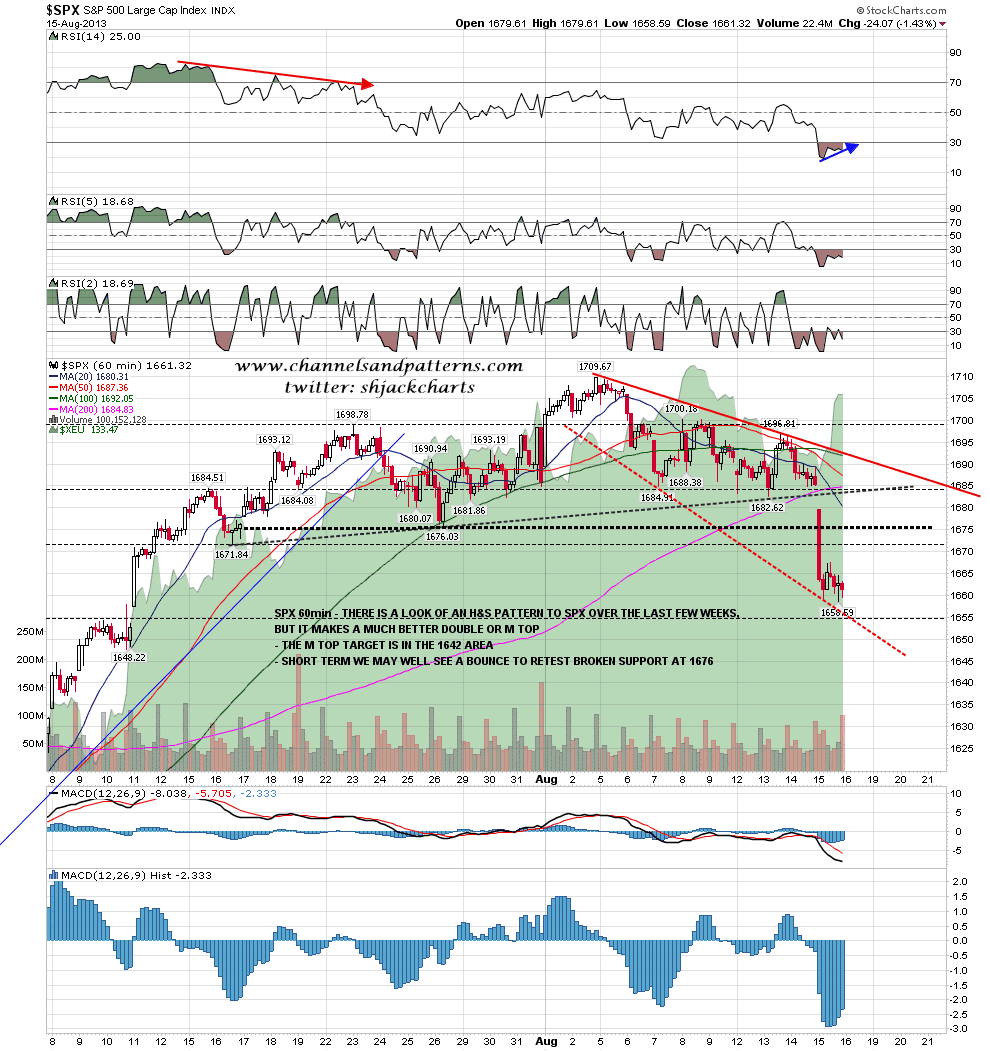
There were a few people talking about breaking down from an H&S yesterday. There is a possible sloping H&S there, and I’ve drawn in the neckline on the chart below, but it’s unbalanced and makes a much better double or M top than an H&S. The M top target is 1642 SPX after the break below 1676 support yesterday. SPX 60min:
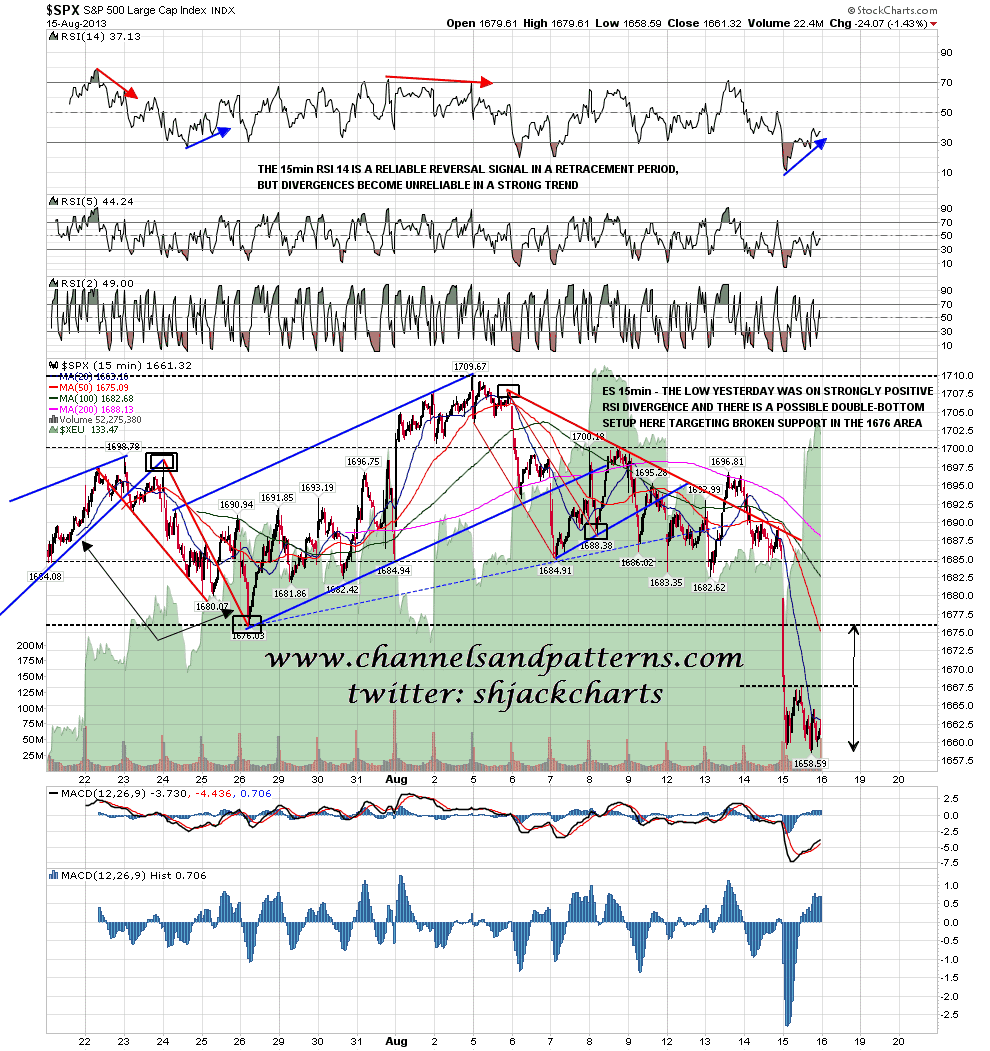
If we are going to see retracement or consolidation today then the obvious move would be to retest broken support at 1676. As it happens there is currently a double-bottom setup on the SPX 15min chart to do exactly that, supported by strongly positive RSI divergence that can also be seen on the 60min and 5min charts. If the lows yesterday hold (more or less) and we see a break over 1668 then the double-bottom target will be in the 1676/7 area. SPX 15min chart:
On other markets the uptrend on CL has now resolved into a high quality bearish rising wedge. I’m looking at this for short entries and wedge resistance and support are currently at 108.30 and 107.10 respectively. CL 60min chart:

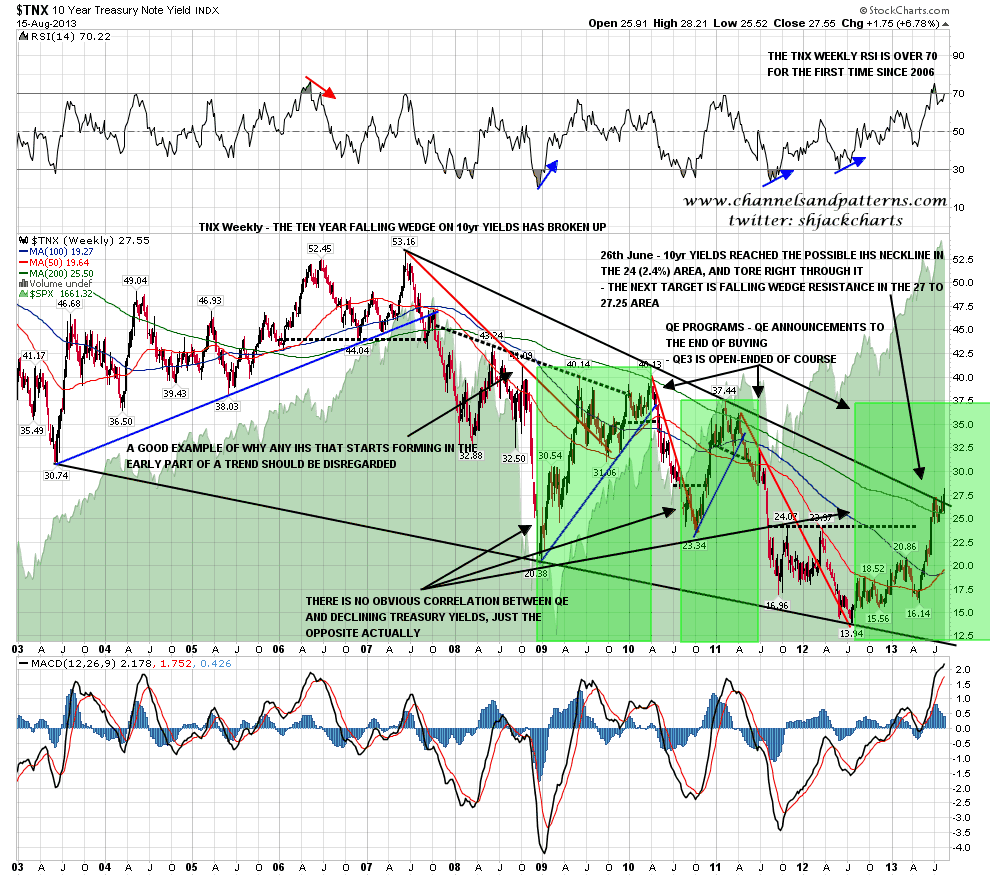
TLT broke below 105 yesterday and while the long scenario there isn’t dead, it is a lot weaker this morning. I’ve mentioned before that there is a wedge target on TLT at 99, and I have other bonds charts which are warning that quite a bit of further downside for bonds may be on the way. I’ll write a dedicated post on bonds this weekend if I have a chance, but meanwhile here is a chart of TNX where you can see a ten year falling wedge in the process of breaking upwards. TNX is 10 year treasury yields of course so this bullish break on TNX is a bearish break on bonds. I have also shown on this chart the very strong positive correlation between QE periods and rapidly rising interest rates. TNX weekly chart:
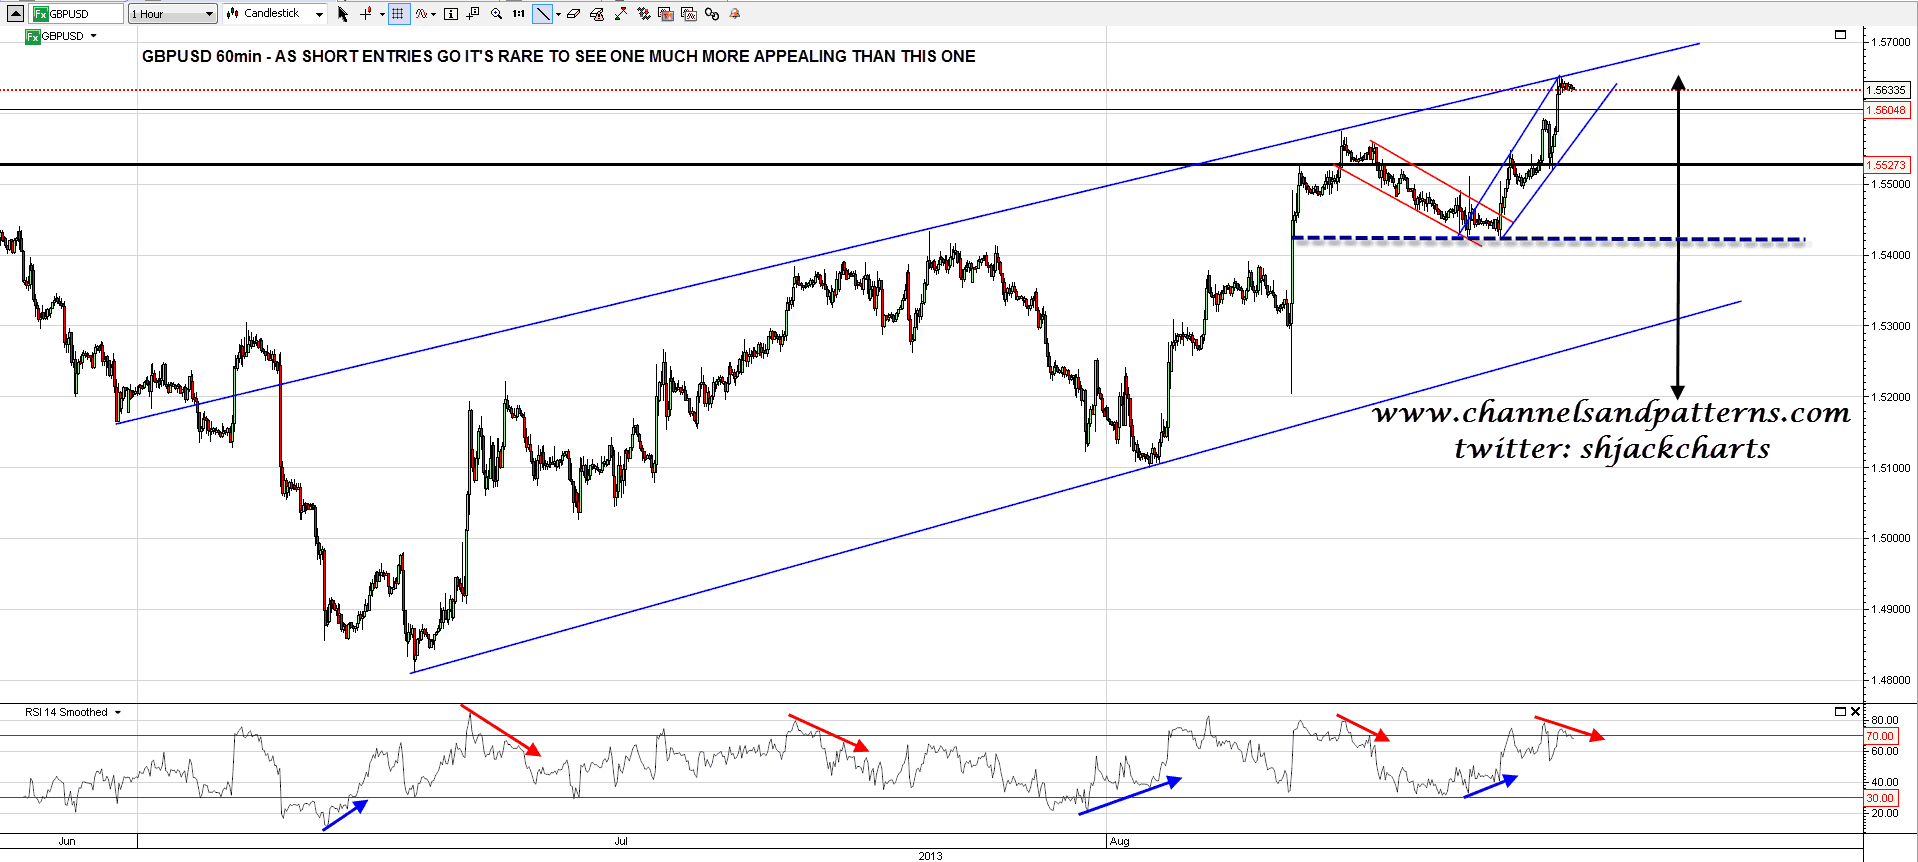
I posted a GBPUSD chart on twitter last night showing the really very nice short setup there. At the time of writing the setup has improved further with the formation of a short term double-top and the price is slightly higher than it was last night. Obviously no setup is ever a sure thing but this is a very nice technical short setup with a great risk/reward. GBPUSD 60min chart (from last night):
I won’t post a gold chart today but gold broke over resistance and the double-top setups were trashed. I’m expecting more upside. On ES/SPX today I’m leaning towards consolidation or a bounce and if we do see a retest of broken support in the 1676 area I would see that as an ideal area to reload short.
