
Well there was no budget agreement yesterday, which wasn’t much of a surprise really, as no-one seemed particularly interested in talking …. to each other, or compromising. The Republicans seem more likely to be more damaged by this shutdown and may well blink first and soon to avoid serious electoral damage, but I would expect at least a couple more days of posturing and empty rhetoric before a face-saving formula is found.
I did read a suggestion yesterday that the US should trade the whole lot of these clowns for a dog and then shoot the dog, but there are obvious practical and ethical problems with this proposal. For starters it seems most unlikely that any dog owner could be persuaded that the trade was worth doing without large additional financial incentives, and secondly this seems unfairly hard on the dog. Hopefully a better formula can be found.
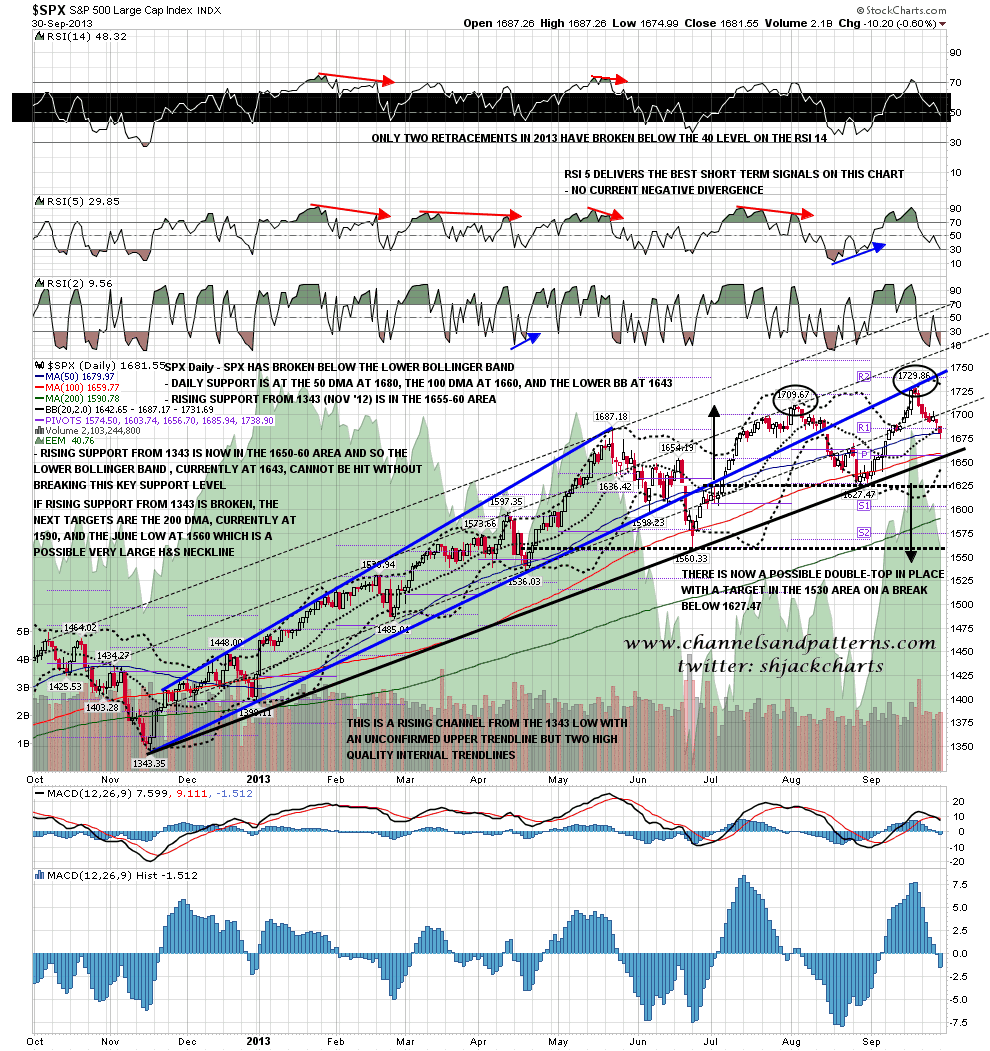
Meanwhile the market was jittery all day yesterday and prone to move rapidly on rumors of progress. Obviously that may persist for the rest of the week. SPX closed at the 50 DMA, and that is a possible reversal level on the daily chart, though I’m expecting SPX to break through to the 100 DMA in the 1660 area this time. SPX daily chart:
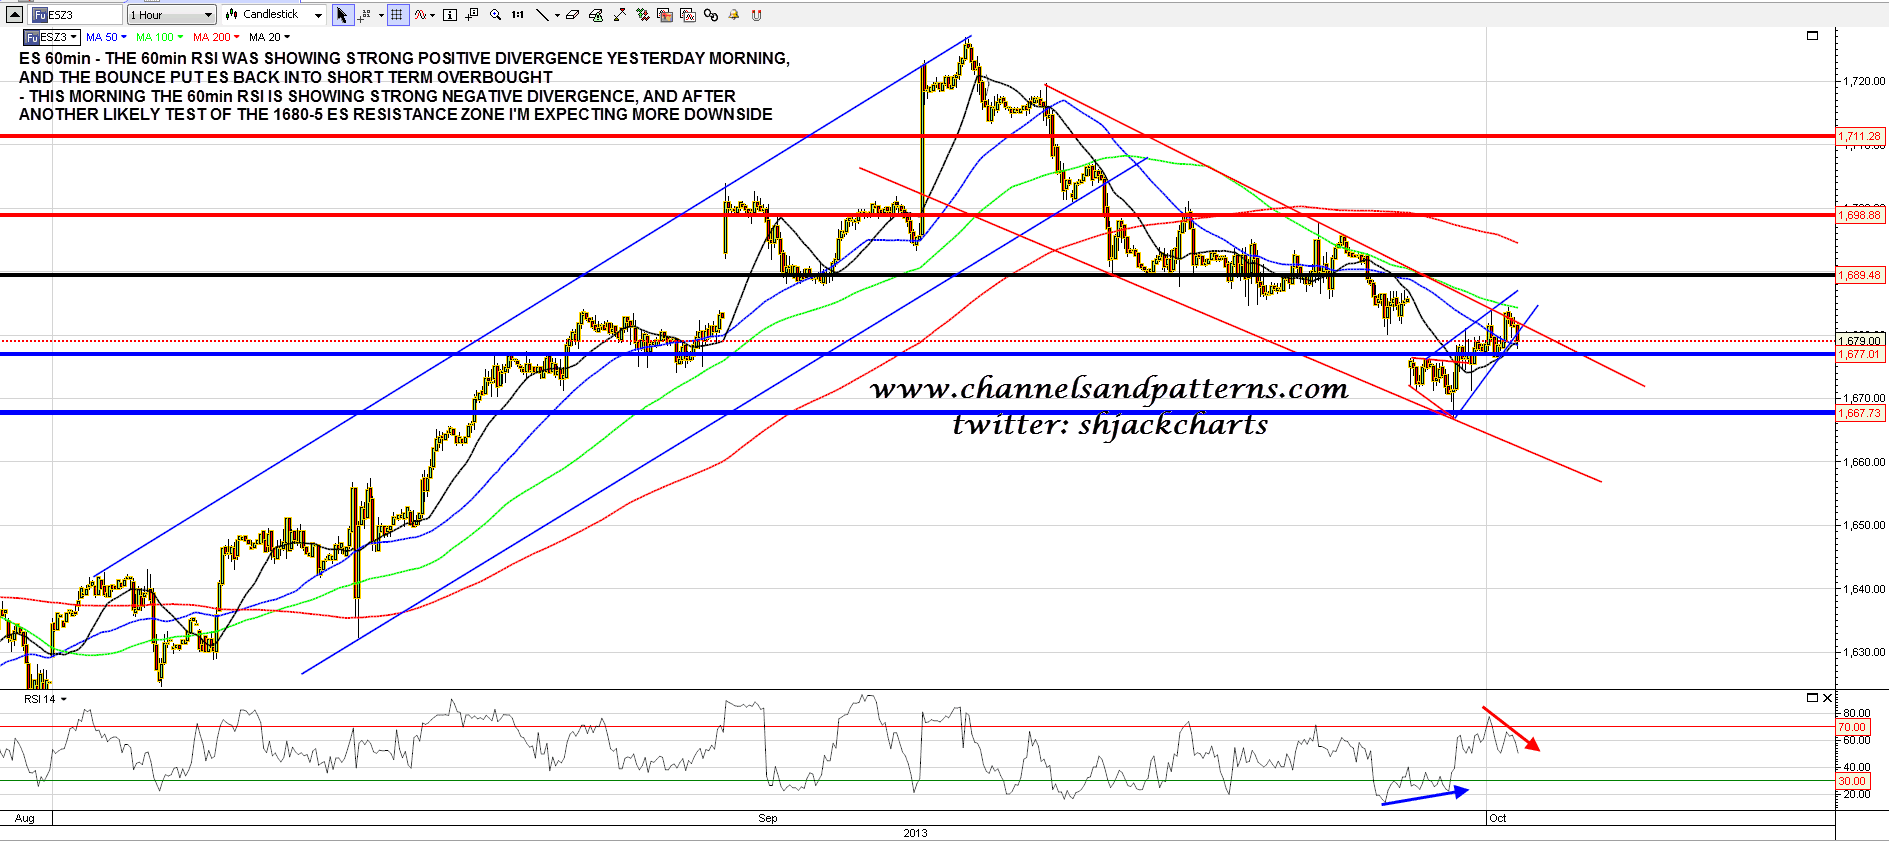
There was marked positive RSI divergence on the ES 60min RSI yesterday warning of the likely bounce that we saw yesterday. This morning that has played out and we now have marked negative divergence on the ES 60min RSI. We might see another run at the 1680-5 resistance zone, but after that I’d be looking for more downside. ES 60min chart:
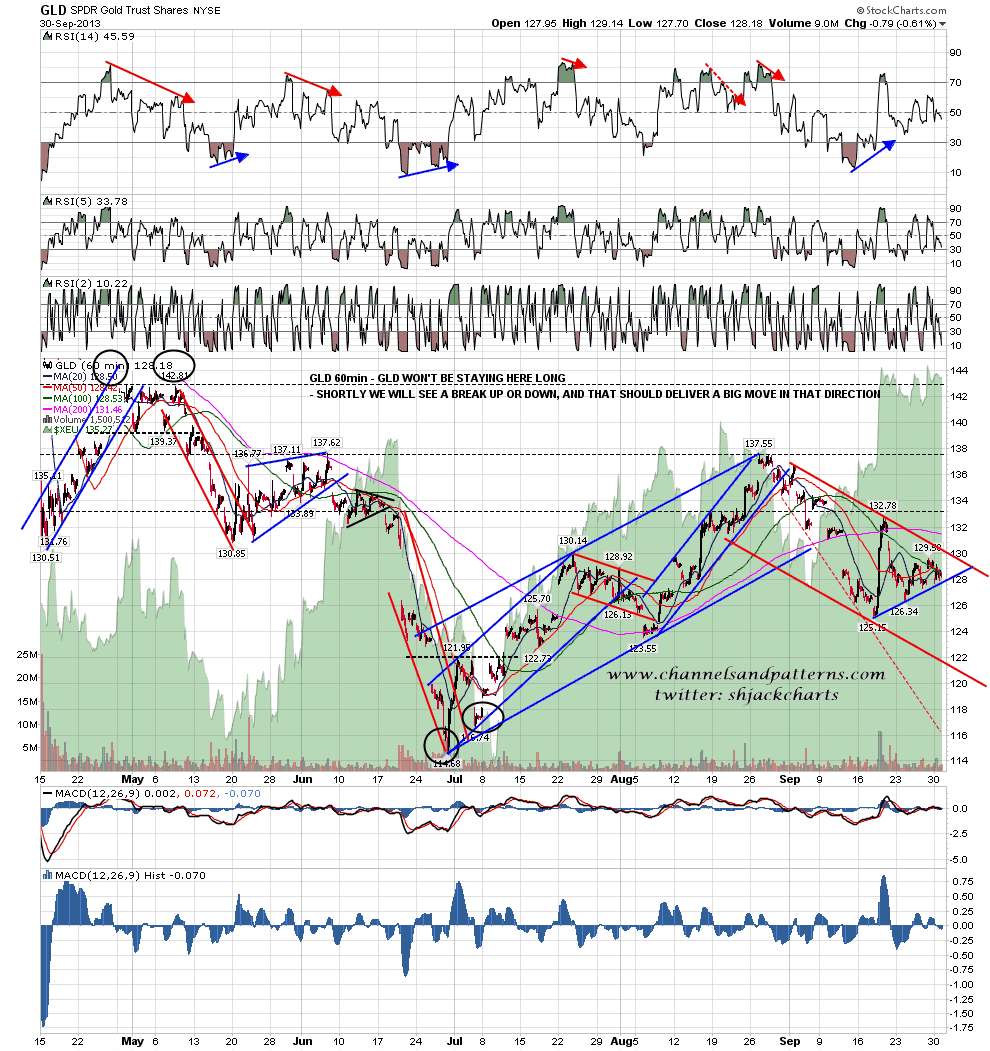
I mentioned yesterday morning that gold might be about to start another leg down. That has started since I looked again at GC this morning and as I mentioned yesterday the key short term question is whether the recent lows in the 1290 area can hold. I suspect not. Here’s the setup shown on the GLD 60min chart:
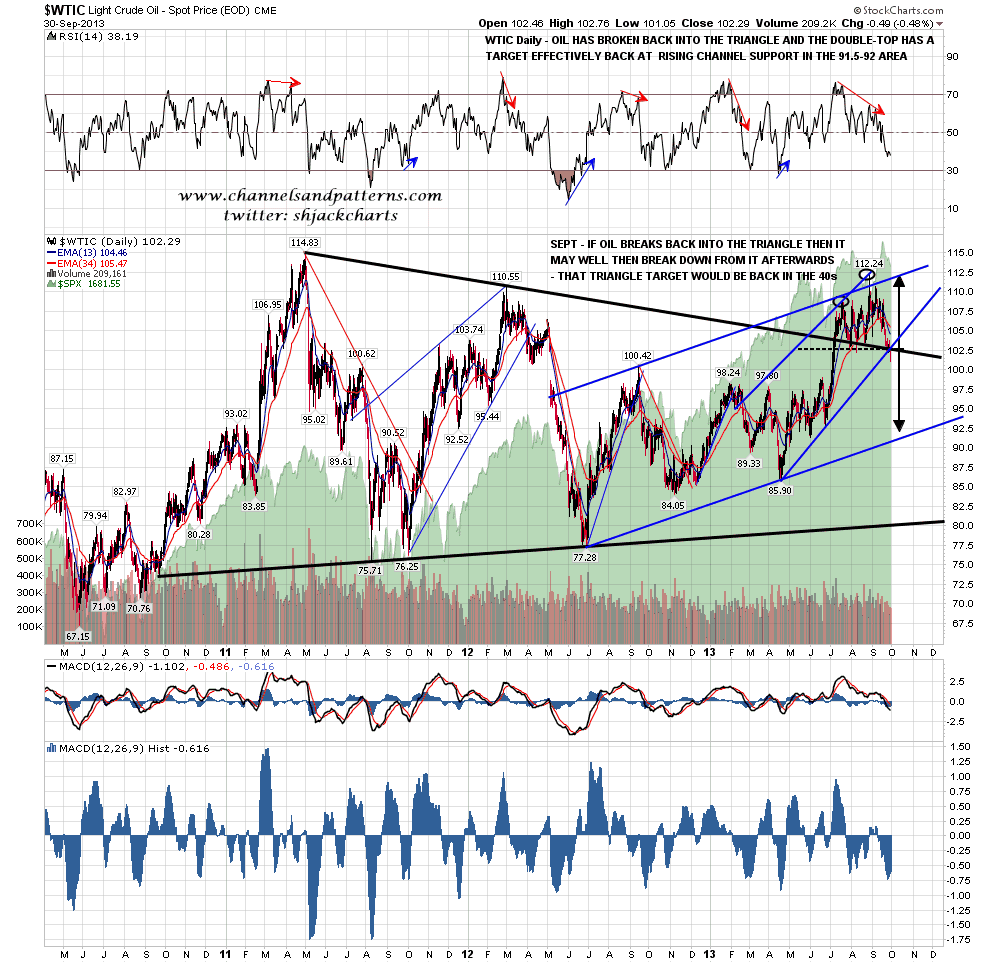
CL has broken down from a double-top as I was showing on the CL chart yesterday morning. I’m showing that on the WTIC chart this morning to show the obvious target trendline in the 92 area. WTIC daily chart:
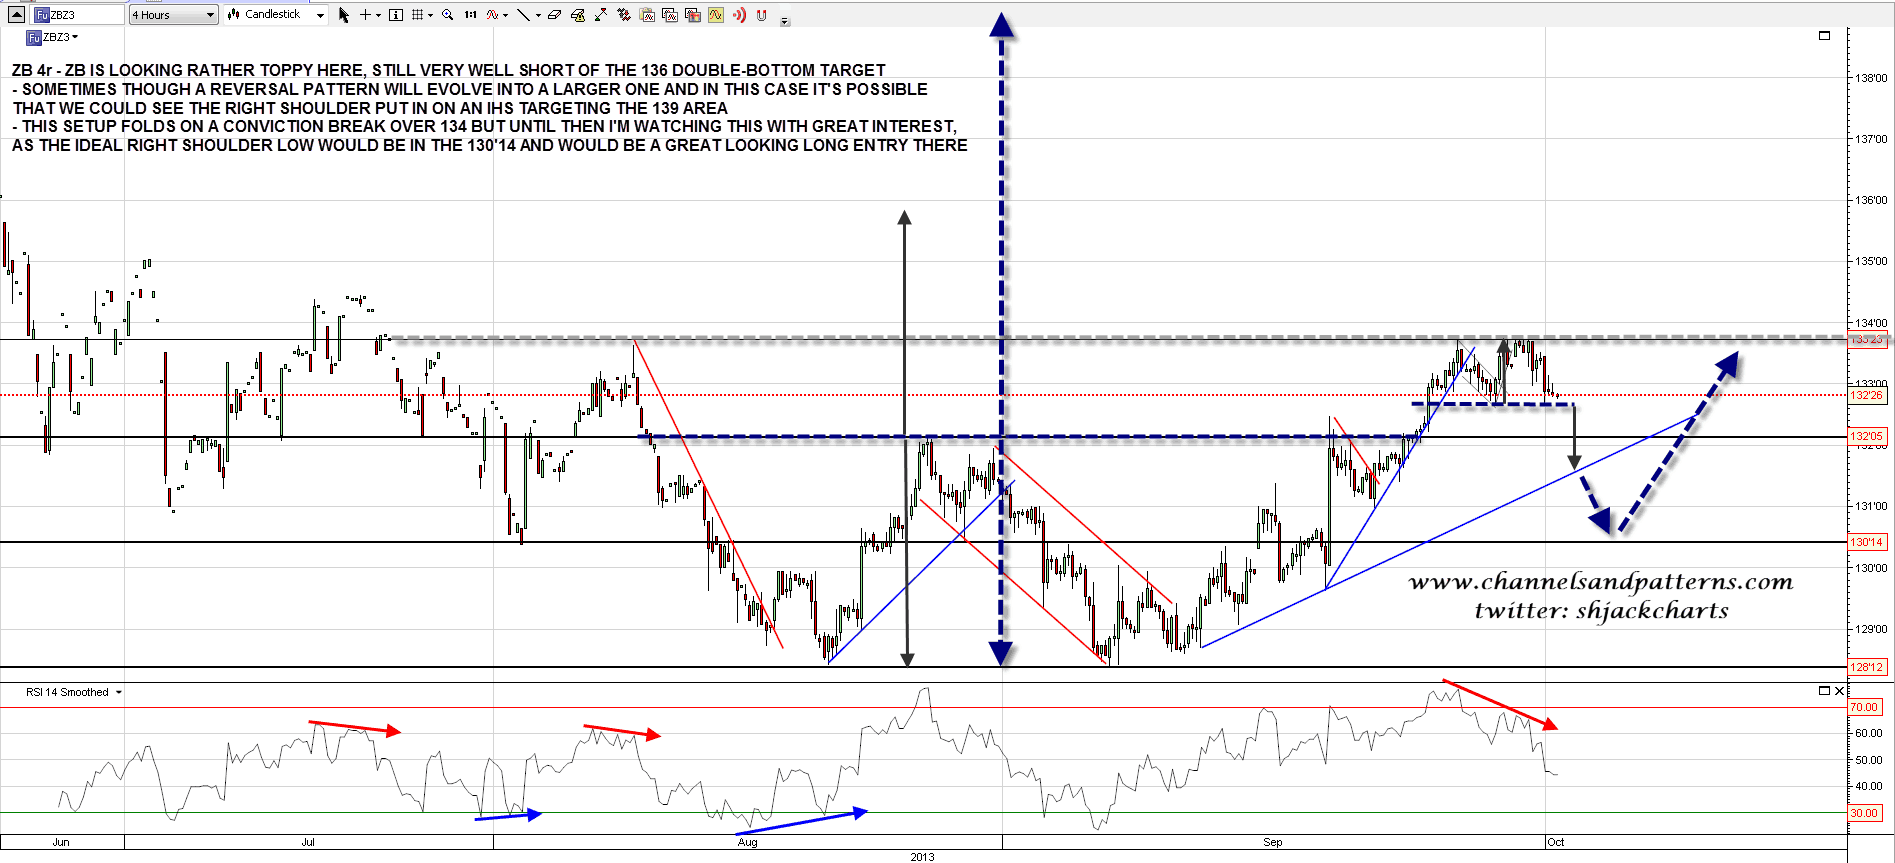
ZB has been looking toppy the last couple of days and has failed so far to break over 134. I’m considering the possibility that a larger IHS may be forming and I’ve shown that possibility on the chart below. ZB 4hr chart:
I’m expecting more downside today and for yesterday’s opening gap to remain unfilled. Obviously there is a high degree of political news risk today and if that gap is filled I would take that as a serious warning signal to bears that the obvious downside targets may not be reached.
