
All equities edition again today as I’m still not feeling that well and I’m considering options for the next short term high on SPX. There are a number of important trendlines in the same target range so I’ll go through those individually.
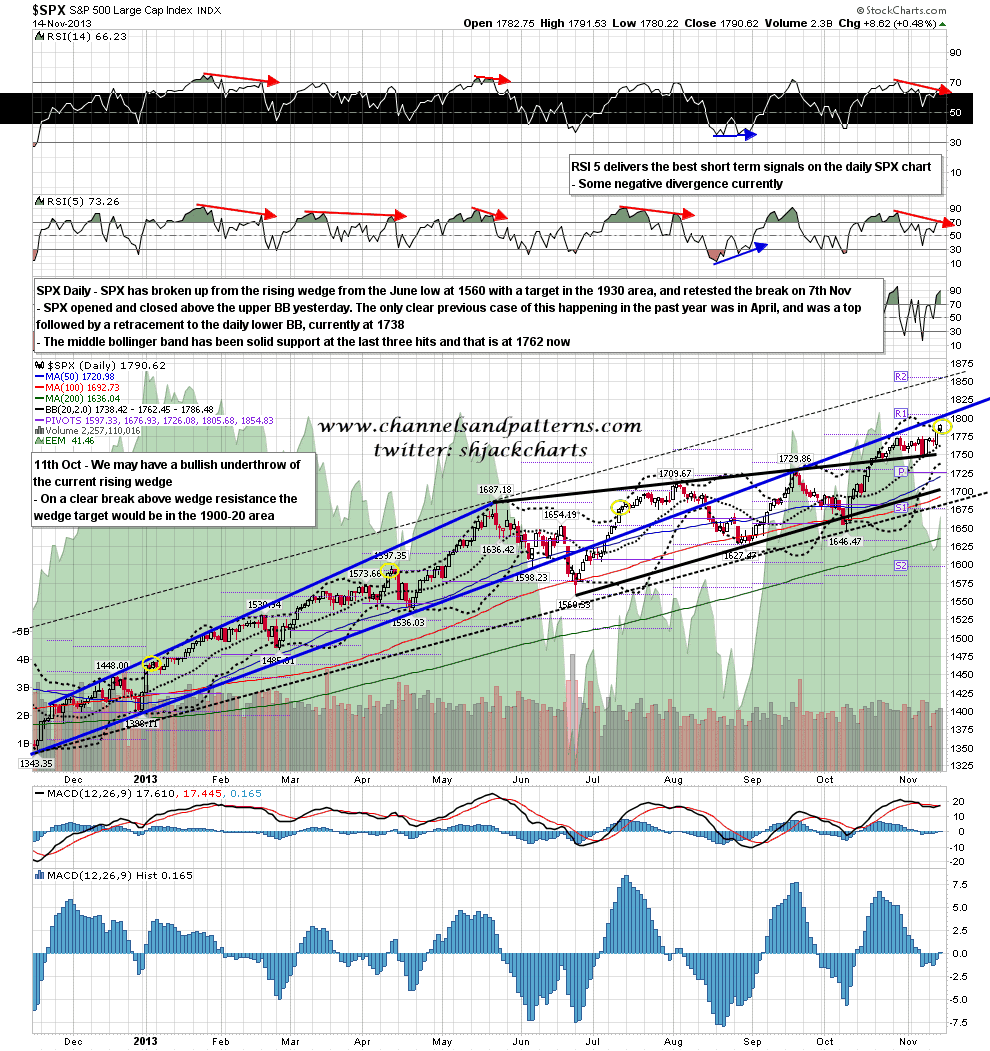
Yesterday’s daily SPX candle opened and closed above the daily upper bollinger band. That is rare and for obvious reasons generally signals either an imminent retracement or period of consolidation. I’m expecting SPX to make a short term high in the next two or three trading days, and the important trendline target I’m looking at on the chart below is broken rising megaphone support from last November. That held at the last test at the September high and I have that trendline in the 1795-1800 SPX area today. SPX daily chart:
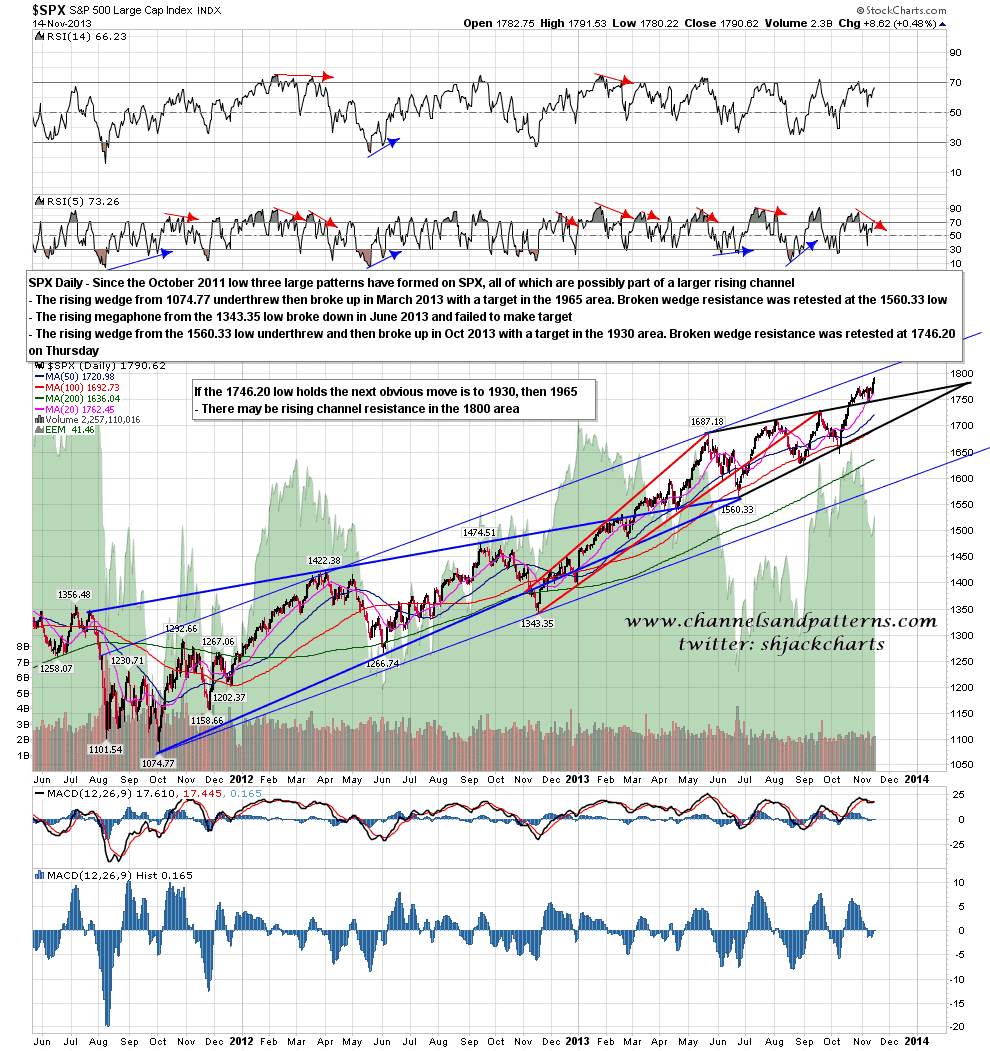
The second trendline is one the daily chart below from the October 2011 low, and that is possible rising channel resistance for the move since then. I’m doubtful about this holding long but we may well see the next short term high at this trendline, which I have currently in the 1800 area. SPX daily chart from Oct 2011:
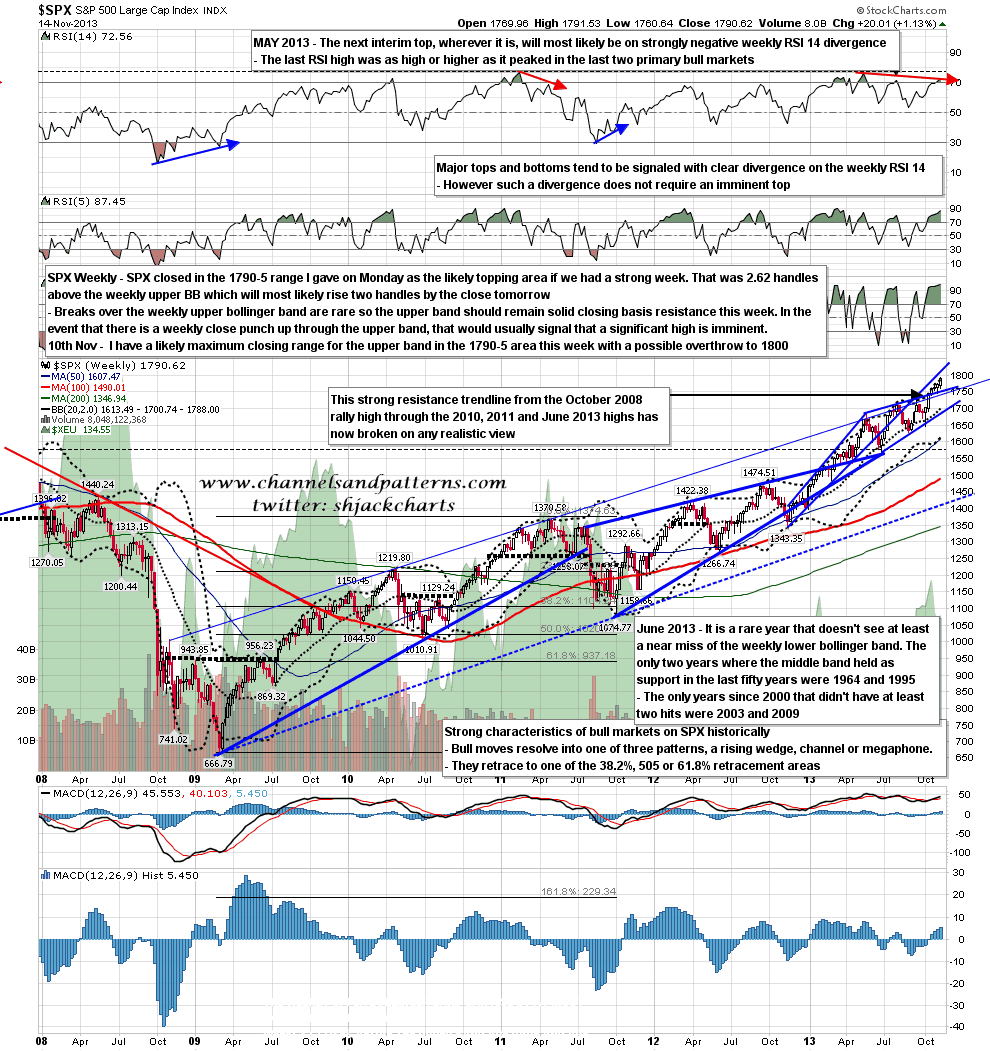
Could we hit those targets today? Sure, though unless we are going to see a rare (and highly bearish) punch above the SPX weekly upper bollinger bands then I’d expect the close today to be flat or down. The close yesterday was 2.6 points above the weekly upper BB, and while I’m expecting that weekly upper BB to close a couple of points higher today, SPX shouldn’t exceed yesterday’s close by much at best. Worth adding as well is that the ES weekly R2 pivot is at 1788.40, and that also tends to be decent weekly closing resistance. SPX weekly chart:
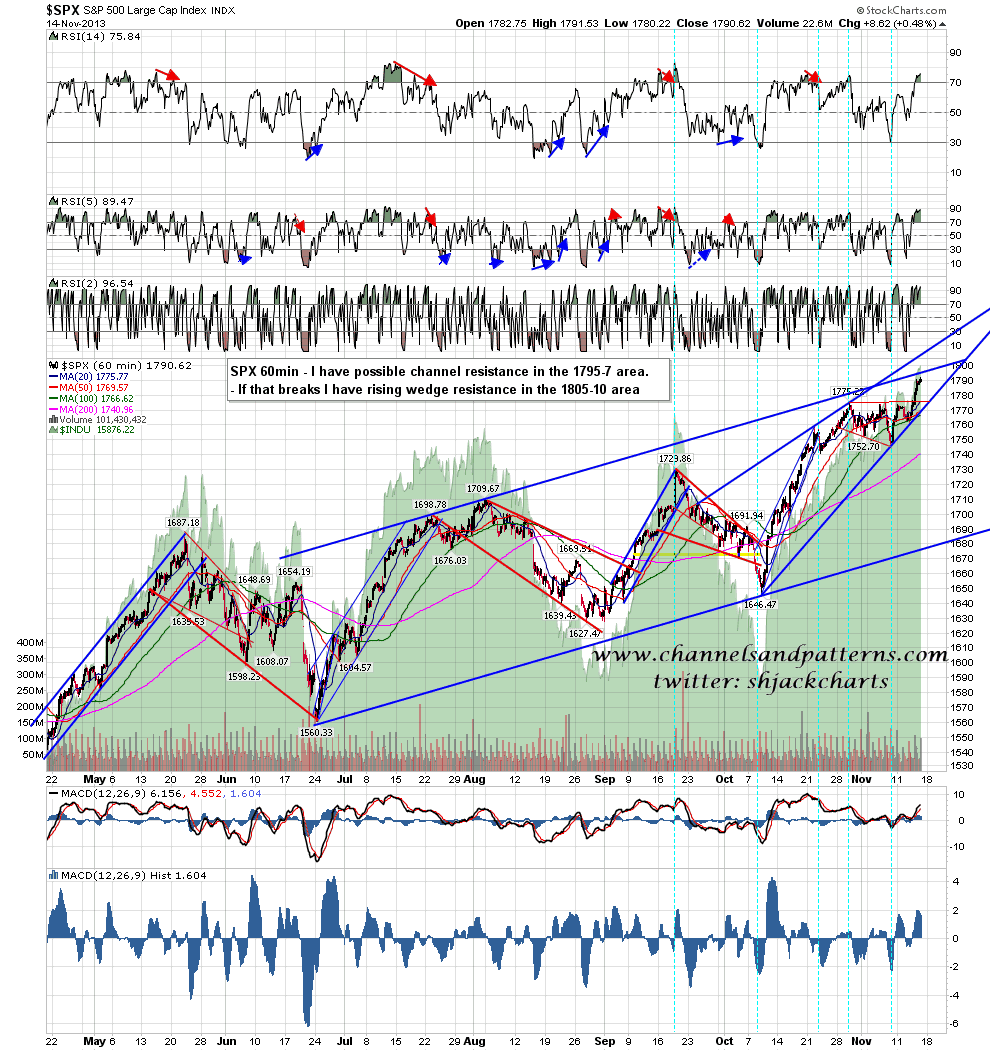
I’m not seeing any imminent sign of reversal on the SPX 60min chart, so most likely we get a morning dip this morning and then see a new high either today or Monday. I have two trendline targets on this chart and the lower target is possible rising channel resistance from the 1560 low which I have in the 1795-7 area. If that breaks, and there is obviously a lot of other resistance in that area so it may well hold, then I have rising wedge resistance from the 1646 low in the 1805-10 area. SPX 60min chart:
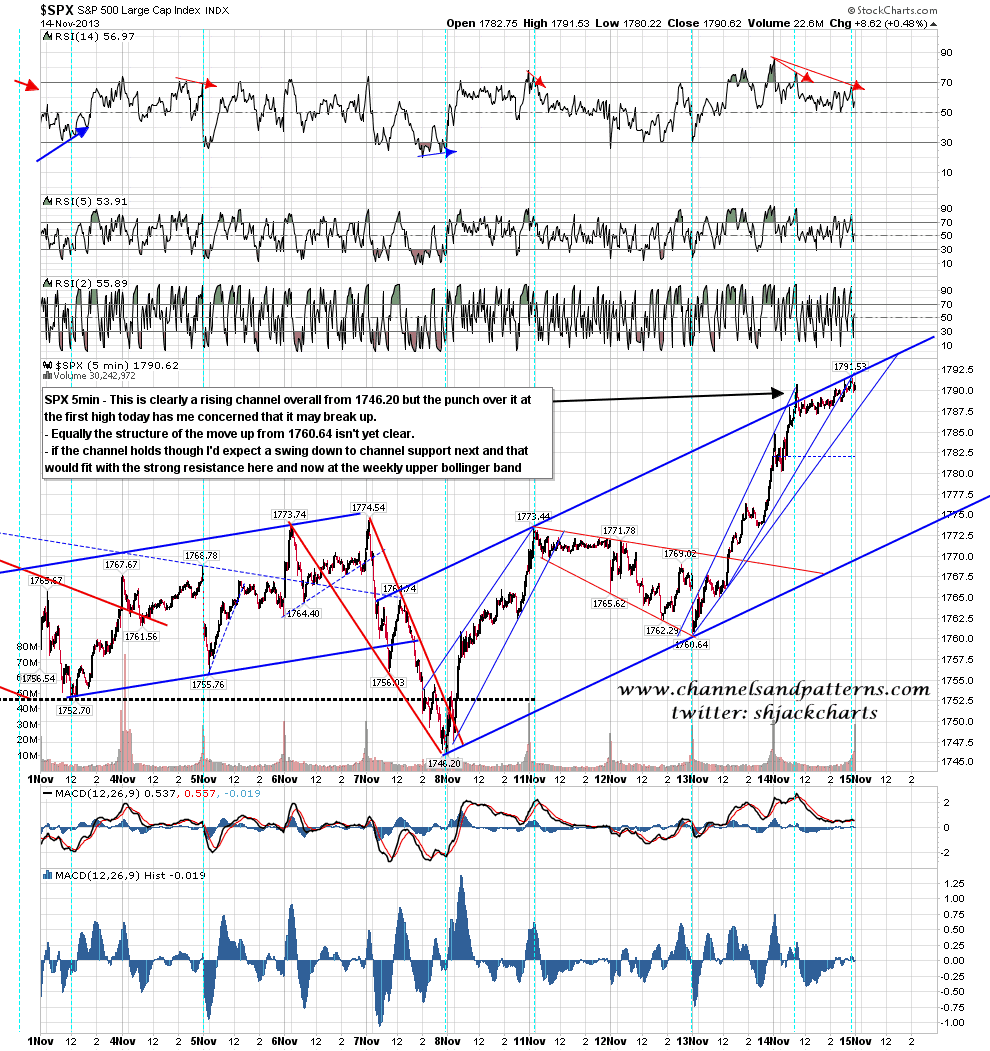
I posted a 5min chart yesterday night on twitter showing what is clearly a rising channel on SPX from the 1746.20 low. As I pointed out though, the pinocchio through channel resistance at the first high yesterday was a signal that this channel might break up. That should be clear near the open today and if we are to see a swing down to test channel support that is currently in the 1770 SPX area, though rising rapidly of course. SPX 5min chart:
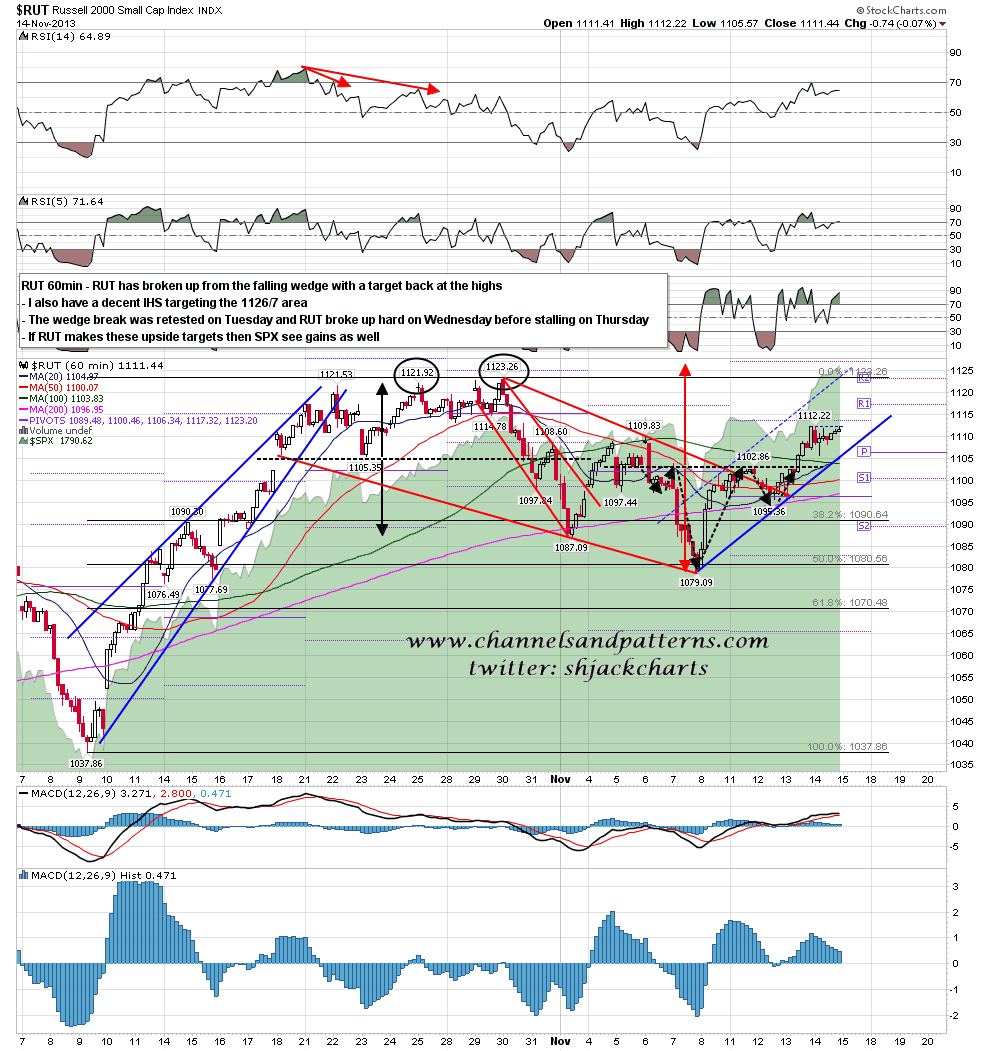
RUT was the dog that didn’t bark yesterday and I’m considering what that might mean here. A move towards a test of the highs was the obvious move but RUT just retested Wednesday’s high. That was surprising. RUT 60min:
Janet Yellen had a very entertaining morning in front of the Senate Banking Committee yesterday morning, and with some wittily ironic remarks about there being little obvious correlation between QE and rising asset prices had me laughing out loud. There is talk however that she may face some serious grilling about her long rumored but unconfirmed family links with Gringotts Bank. Hopefully that won’t derail her confirmation and deprive the US of what may well be the most talented comedian to be nominated to the Fed Chair in decades:

There is now significant risk to the downside here but I’m not expecting a significant decline today. The normal setup to expect here would be a morning low followed by a push to a new high. That can still run within the channel on the 5min chart, but if that channel resistance holds I’d expect the retracement into rising support to start after a marginal high was made.
