
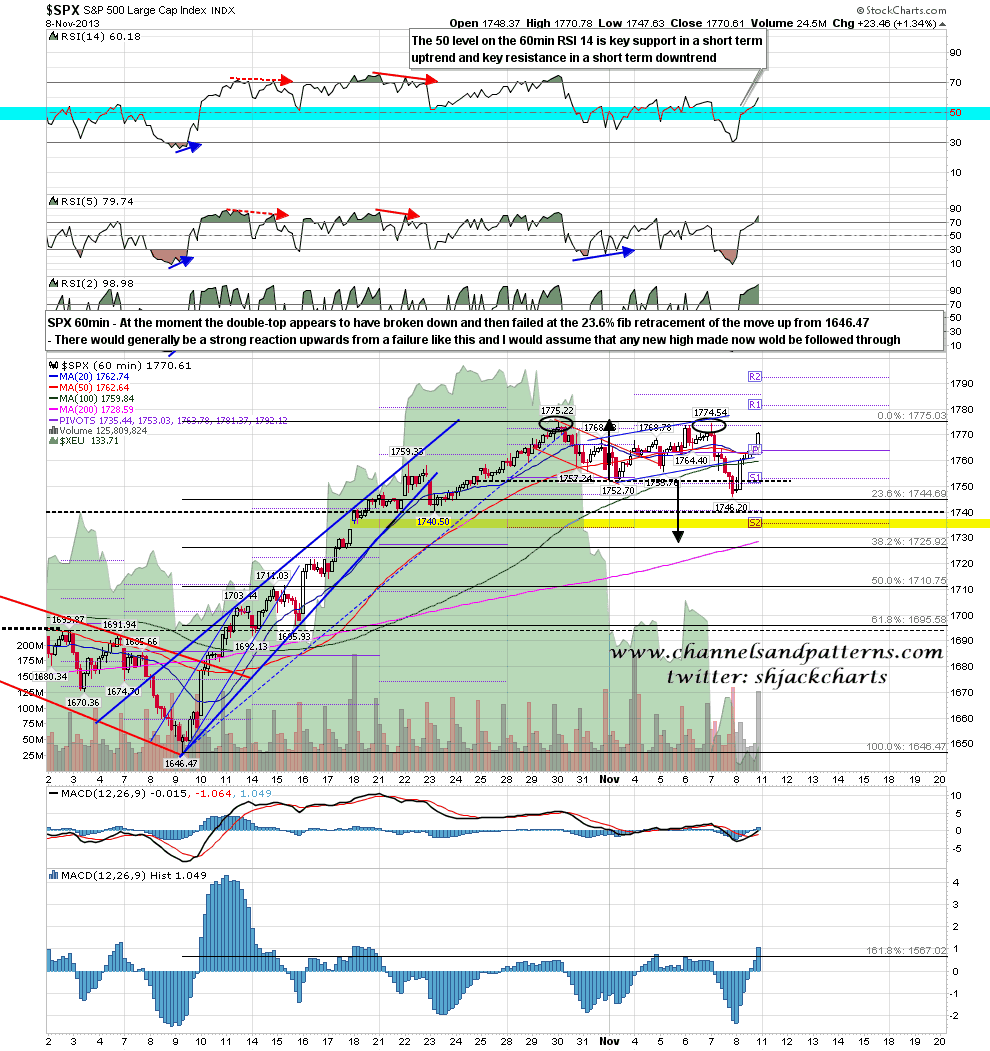
I said on Friday morning that it was possible that the retracement low had been made on Thursday and while I though that was unlikely at the time I wrote it, the very strong reversal back up on Friday means that was most likely the case. You can see from the SPX 60min chart that the low on Thursday was a 23.6% fib retracement of the move up from 1646.47. If the double-top that broke down on Thursday has indeed failed, then I would expect new highs soon and for those new highs to be followed through. SPX 60min chart:
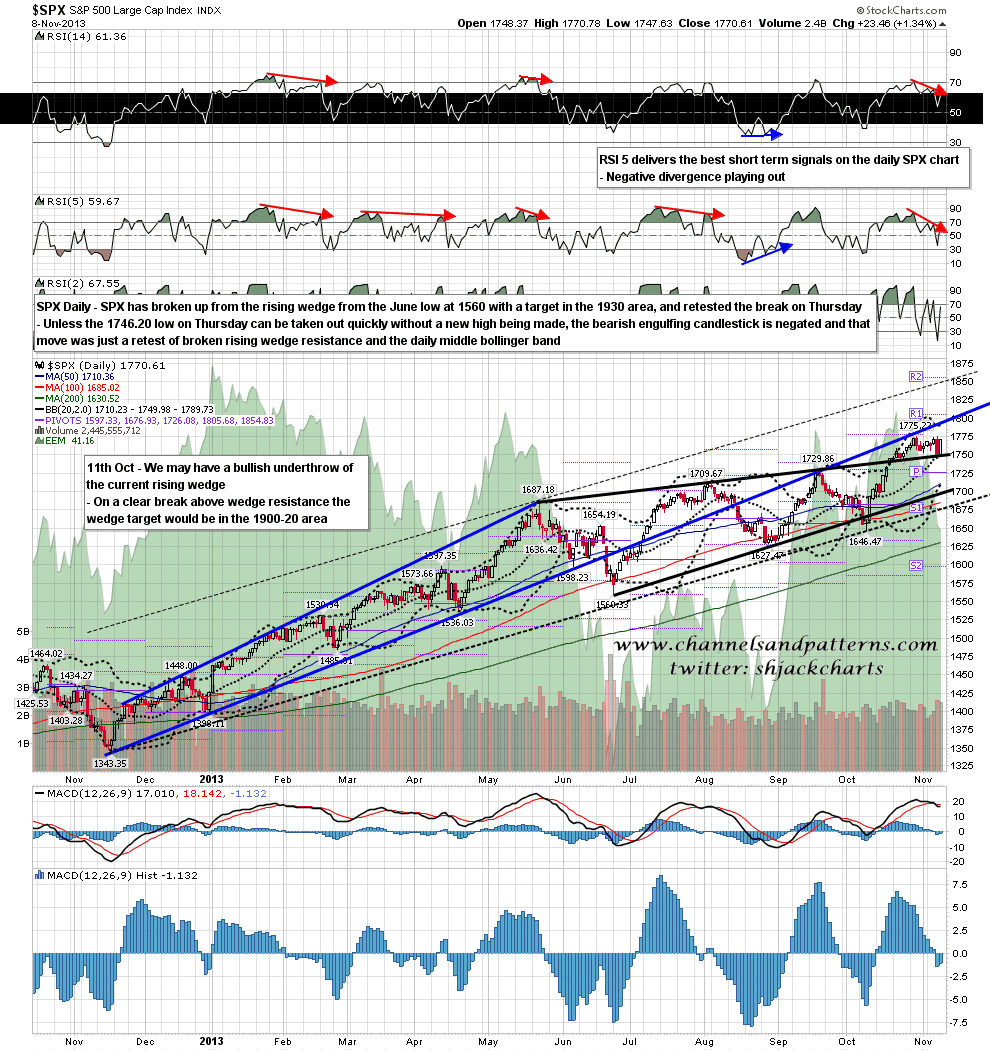
I wasn’t looking at the 23.6% fib retracement though when I was saying that Thursday’s low might hold. I was looking at the SPX daily chart where Thursday’s low was both a test of the daily middle bollinger band and a retest of broken wedge support on the rising wedge from 1560 that broke up last month with a target in the 1930 area. SPX daily chart:
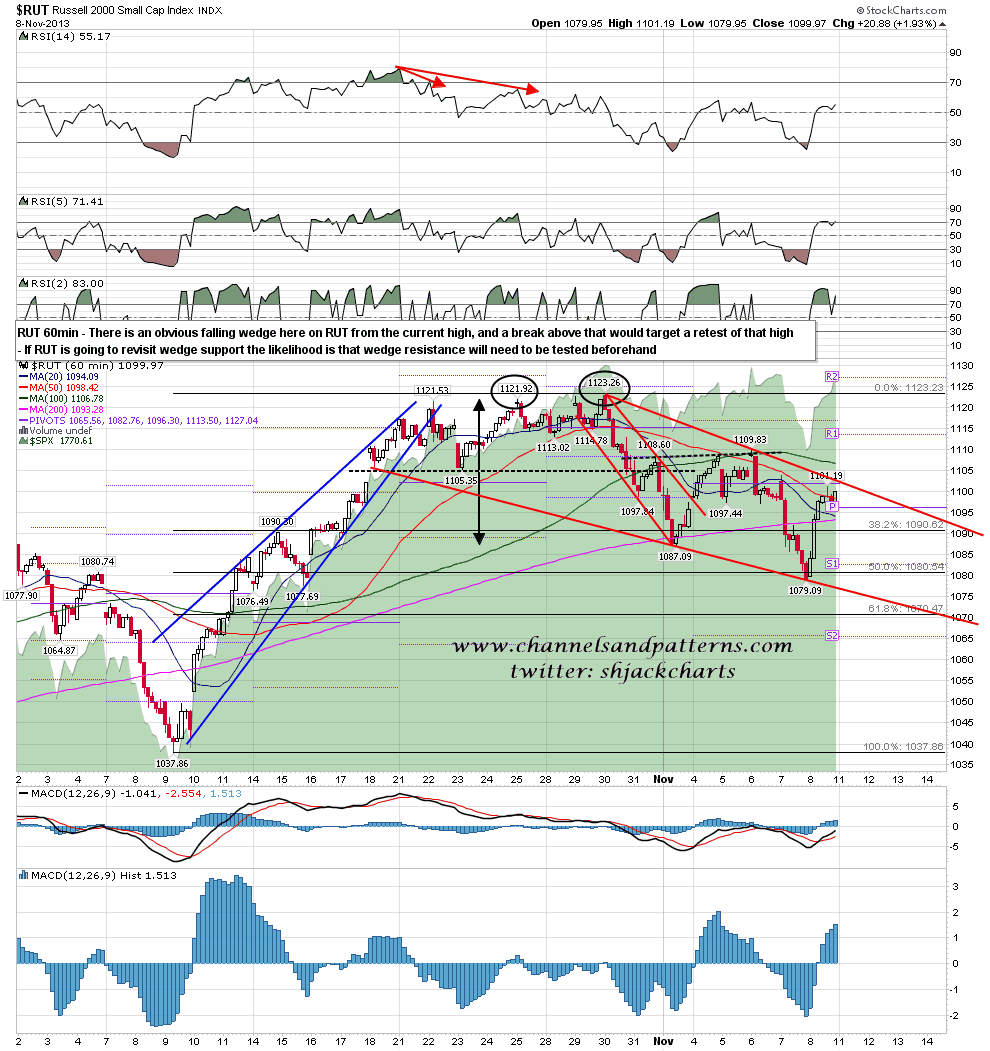
We may well see consolidation or retracement today, but I’d expect RUT at least to go a little higher before we saw a retracement. A falling wedge has formed there from the high and I’d expect a test of wedge resistance before a retracement that could then reach falling wedge support. A break over wedge resistance would target a retest of the current high on RUT. RUT 60min chart:
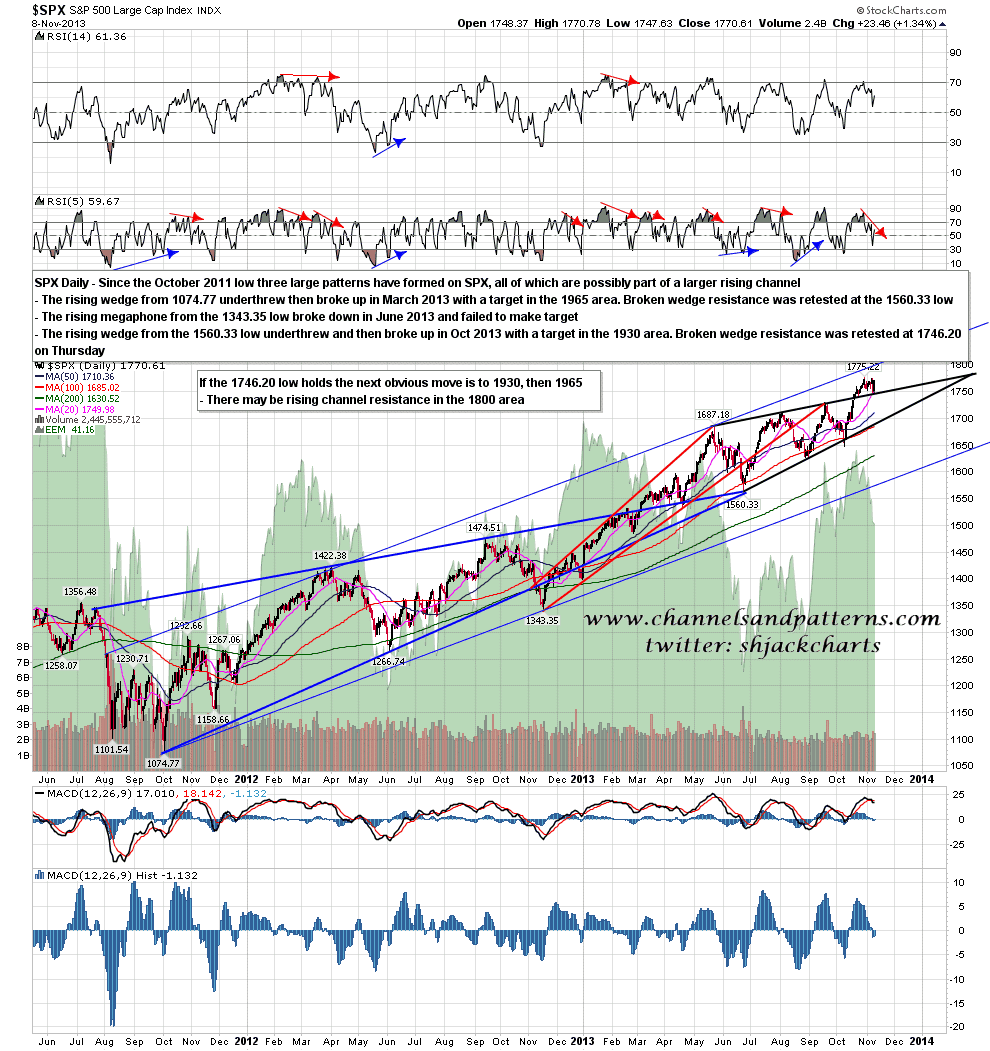
So what is the overall pattern setup here on SPX? Looking at the patterns from the October 2011 low there are three patterns from there which may all be part of a larger rising channel. If we aren’t going to see a move to channel support, which I’ve been considering as a possibility since the Spring high but shows no sign of happening so far, then strong support is now at broken wedge resistance at the low on Thursday and there are two open rising wedge targets above in the 1930 and 1965 areas. In my experience large rising wedges are a lot better at making upside than downside targets and I can’t see any obvious reason to think that those targets won’t be made. Given the short term setup I would take a break to new highs here as most likely being the start of a move towards those targets in the next few months. SPX daily chart from Oct 2011:
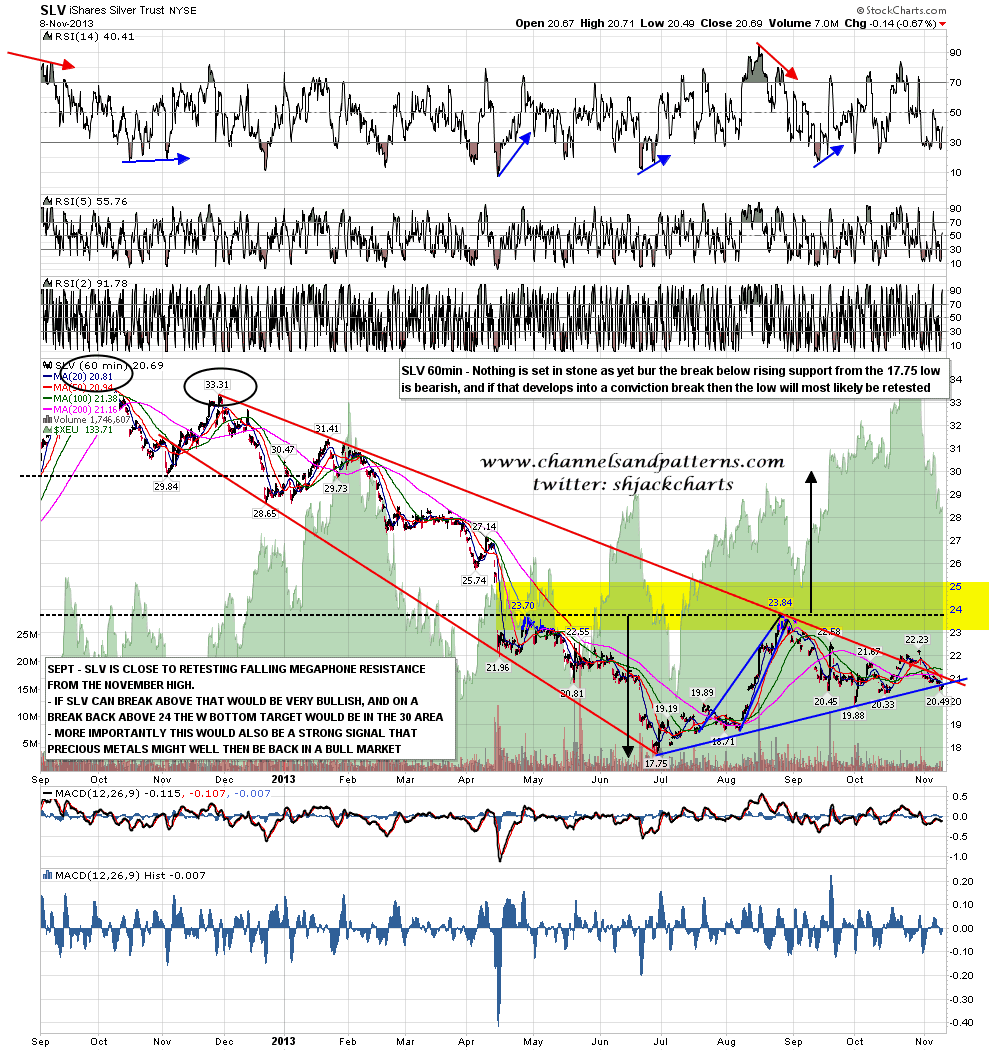
On other markets bond markets are closed today and of the others I’ll just show the SLV chart, where rising support from the current bear market low broke last week and is retesting. if this break develops into a conviction break I’ll be looking for a retest of those lows. SLV 60min chart:
We may go a little higher today but I’ll be expecting a retracement for the move from Thursday’s low to start today. I’d be surprised to see Thursday’s low taken out on that move down and I’ll be looking for decent long entries at that retracement low. The important points to consider here, as long as the low on Thursday holds, is that I have decent open targets on SPX 10% above current levels, and the most bullish six months of the year have now started. The benefit of the doubt has to go to the bull side here. Kudos to Eubie at MarketTalk for calling a strong reversal at 1737 ES on Friday morning.
