
SPX closed last week back above the weekly middle bollinger band and with a strong and rare reversal hammer weekly candlestick. In my weekend post, which you can see here, I looked at the history of these rare candlesticks om SPX going back to the beginning of 1974, and didn’t find any directly comparable candles that did not then continue up to the weekly upper bollinger band, currently at 1873. I am therefore treating last week’s low as the retracement low unless we see strong evidence to the contrary, which would need to start with a decline through strong support in the 1770-4 area. SPX weekly chart:
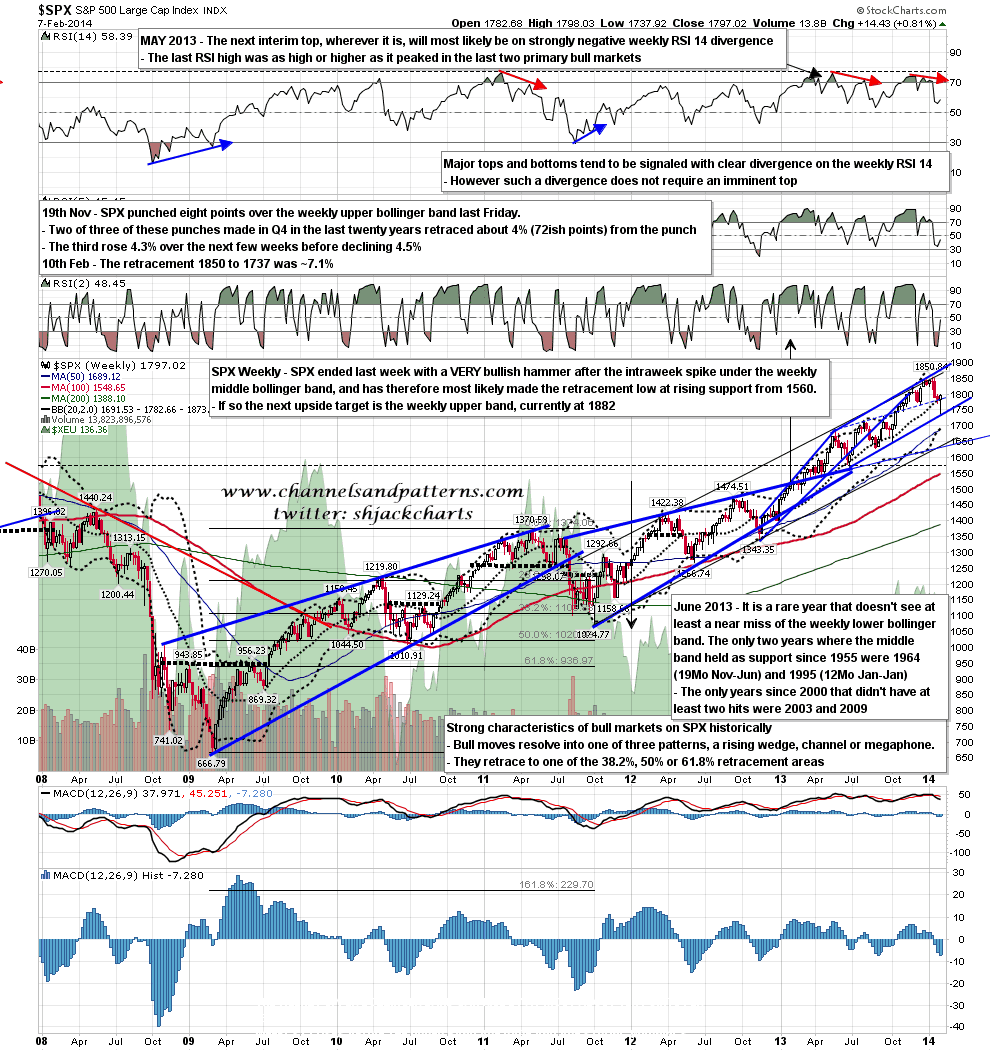
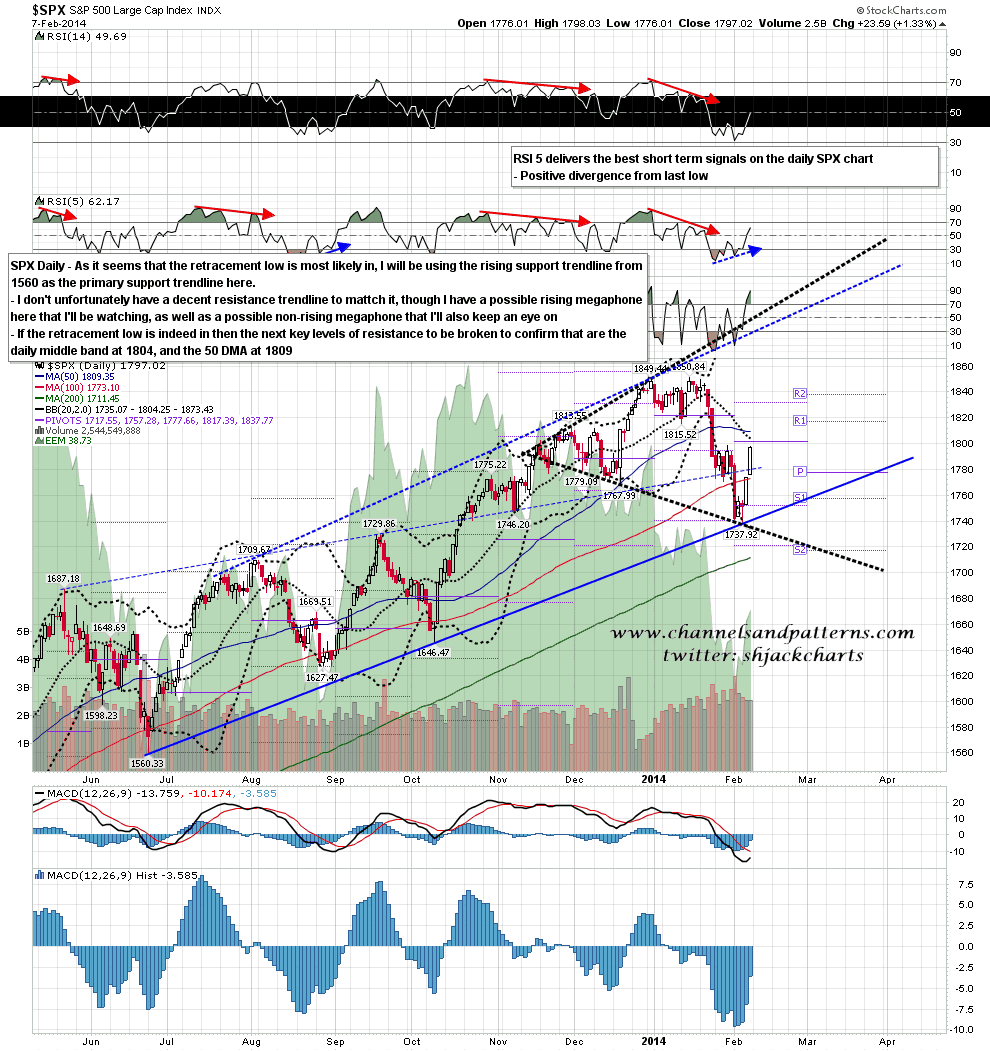
Support at the retracement low was therefore at rising support from the 1560 low, and I’ve been trying to identify a resistance trendline that might fit with that. I have a possible rising megaphone resistance trendline which is not impressive so far, and I am also considering the possibility that SPX is forming a non-directional megaphone. As we approach these resistance trendlines I’ll be watching these carefully. SPX daily chart:
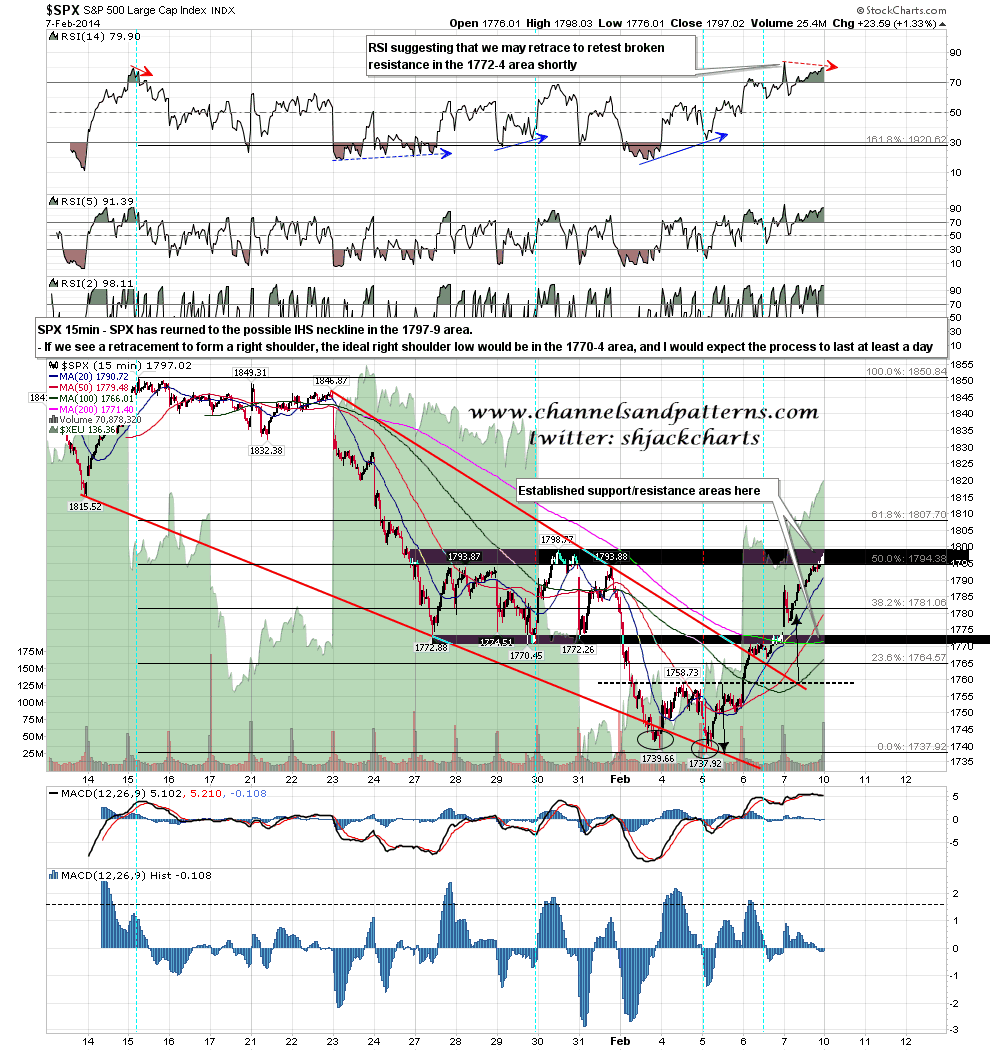
I posted an SPX 15min chart on Friday morning showing the key resistance levels and the possible IHS neckline on SPX. To my surprise that neckline was tested by the close on Friday and if we are to see a right shoulder form then I would be looking for a retest of the strong 1770-4 level for an ideal right shoulder low, and the right shoulder should take at least a day to form. SPX 15min chart:
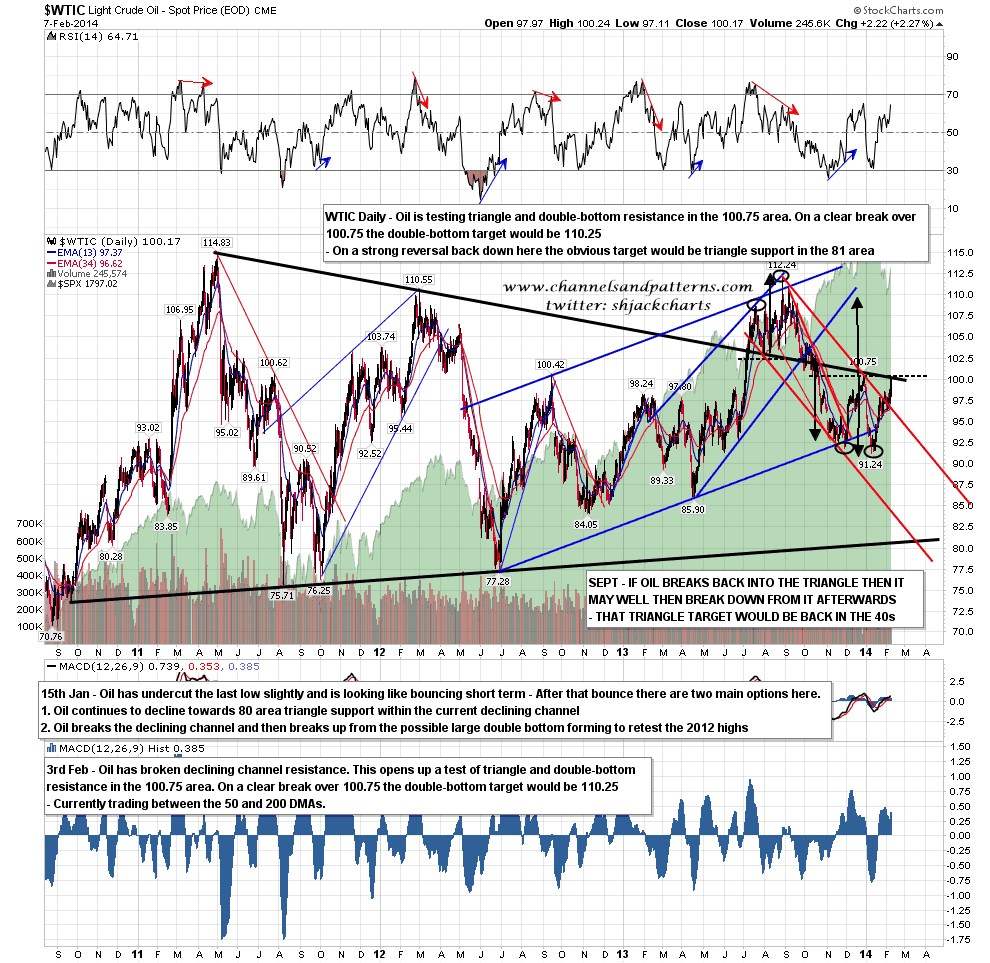
Last Monday I noted that the falling channel on oil was broken and noted that this opened up a test of triangle and double-bottom resistance in the 100.75 area. Oil reached as high as 100.25 on Friday so that test has started. This is an important inflection point. On a clear break up the double-bottom target would be 110.25. On a strong reversal back down the obvious target would be triangle support in the 81 area. WTIC daily chart:
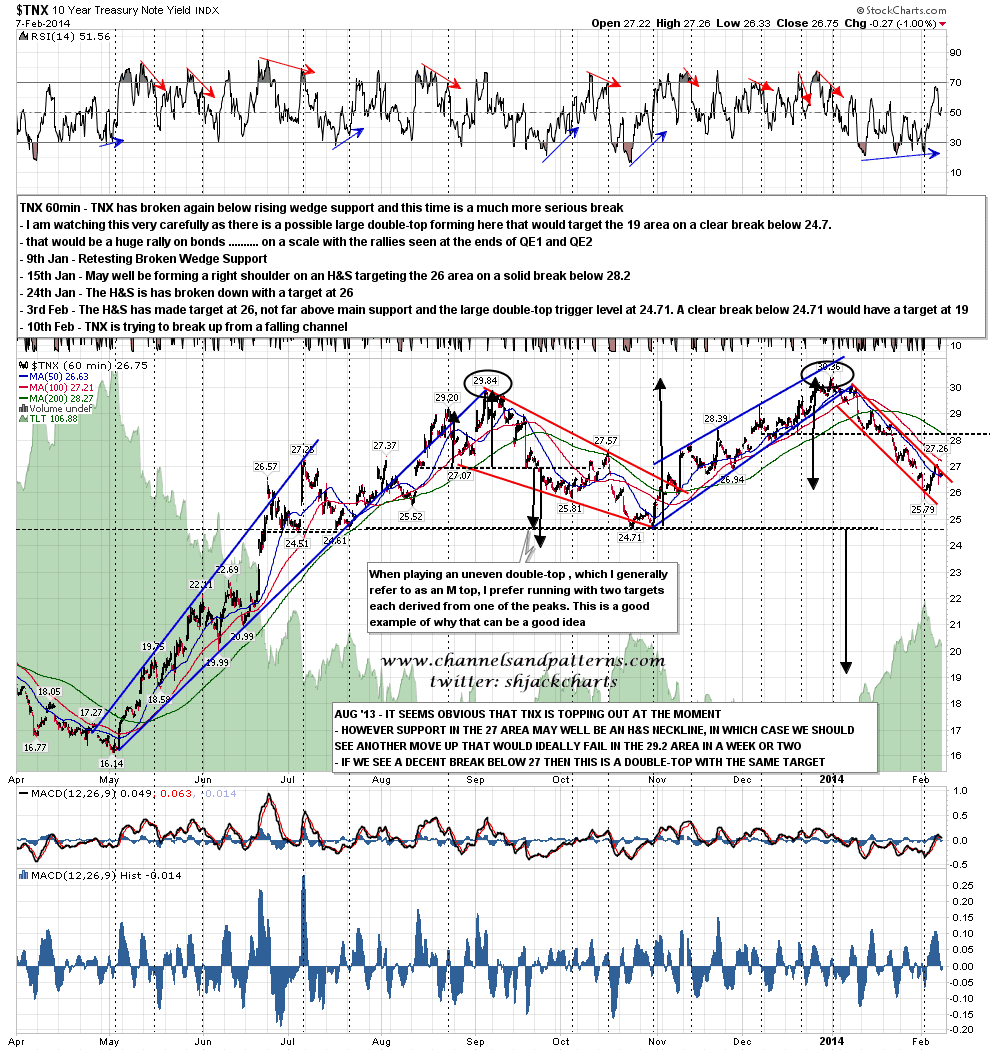
TNX is trying to break up from a declining channel at the moment and a clear break above would open up a decent bounce. Until we see that I’ll continue to lean short TNX and long bonds. TNX 60min chart:
There are a lot of analysts and traders out there who are adamant that this is just a bounce within a downtrend which will be resuming shortly. For those who feel that the odds favor this outcome I would direct them to my weekend post where the history of weekly candles similar to the one last week may well persuade them that at the least such an outcome may not be a certainty. For those who know that this will resolve down I would say that I believe that everyone’s religious beliefs, including theirs, should be respected, but would suggest that they nonetheless lighten up on any short trades just in case the bear rapture is delayed for any reason. I’m leaning towards seeing some retracement on SPX today which I would like to set up a decent long opportunity.
