
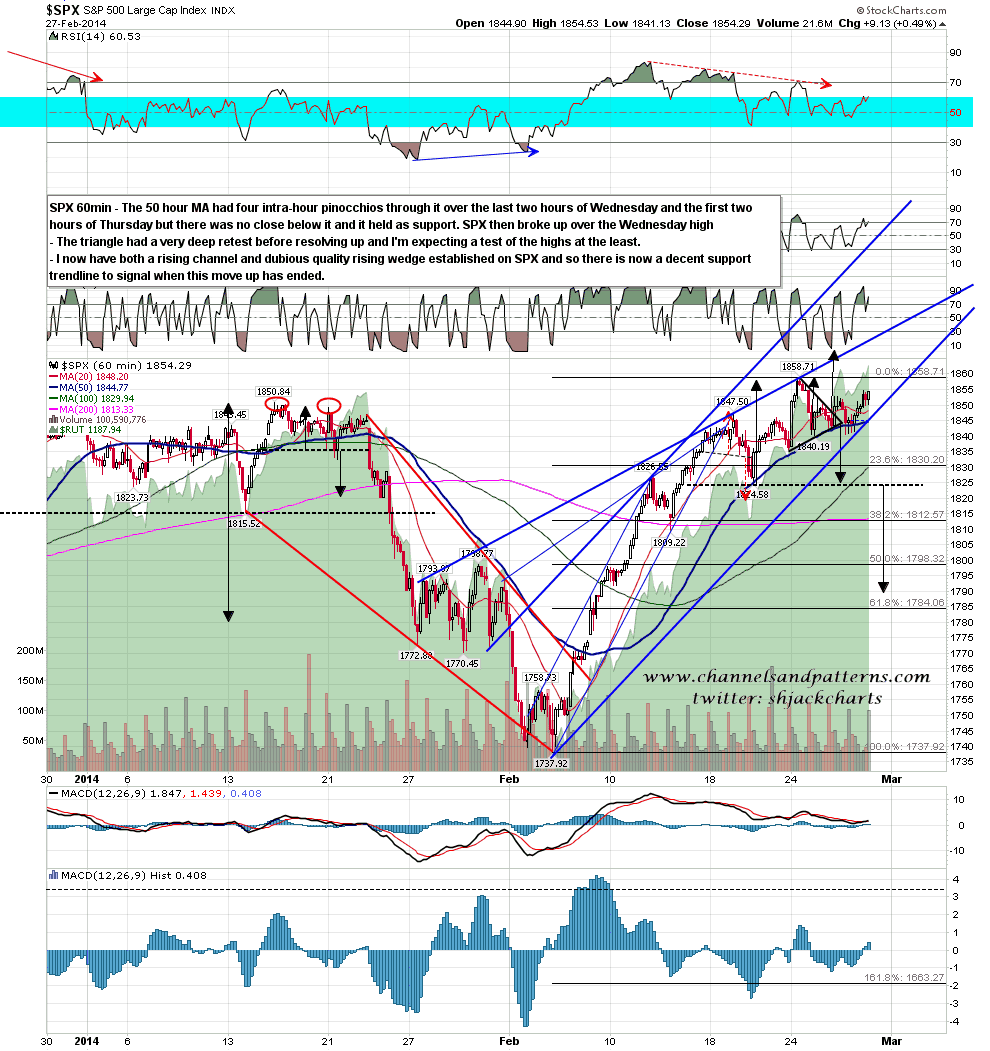
After a couple more exploratory pinocchios through 50 hour MA support at the open yesterday morning SPX took the green pill and broke back up through the ES 50 hour MA. I was grumbling on Wednesday morning about the lack of a clear support trendline for this move up, and even though the bears ended up getting their clocks cleaned (yet again) yesterday, my urgently required support trendline has now been established as I now have rising channels from the Feb low on both SPX and Dow. This will give us a clear marker for when this move is topping out, which as I have mentioned, may be very soon. SPX 60min chart:
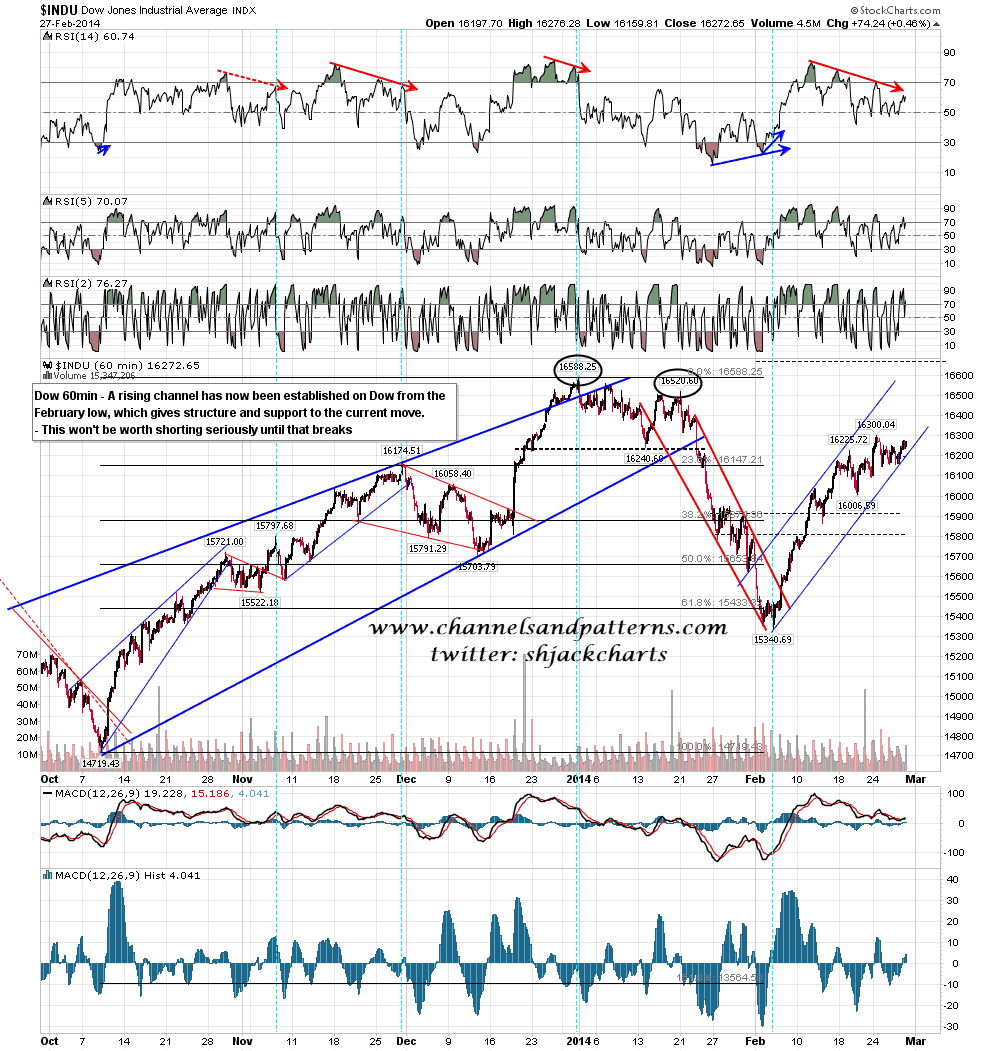
The rising channel on Dow is another nice example. If we do see an big upside breakout on SPX there is room in this channel for Dow to test or exceed the current all time highs. As with SPX there is now little point in shorting this uptrend seriously unless we see a hit of channel resistance or a break of channel support. INDU 60min chart:
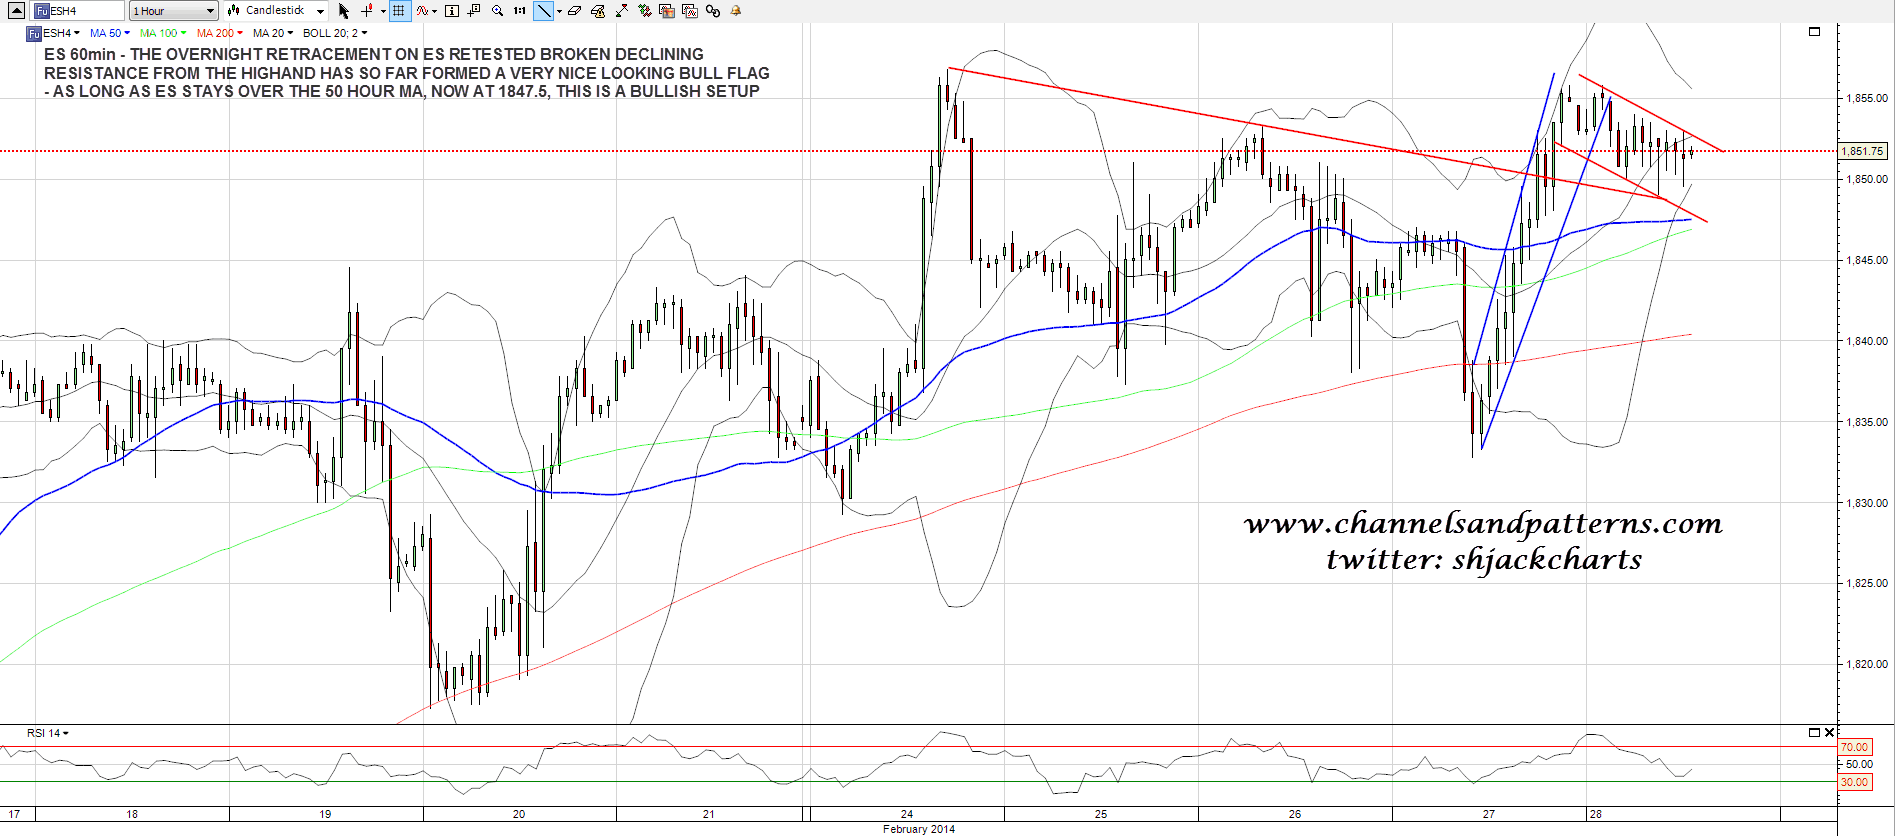
Overnight ES retested broken declining resistance from the current all time high and has formed a nice looking bull flag. Unless we see a breakdown the bulls are starting off with the advantage today and I am expecting to see at least a marginal new all-time high. ES 60min:
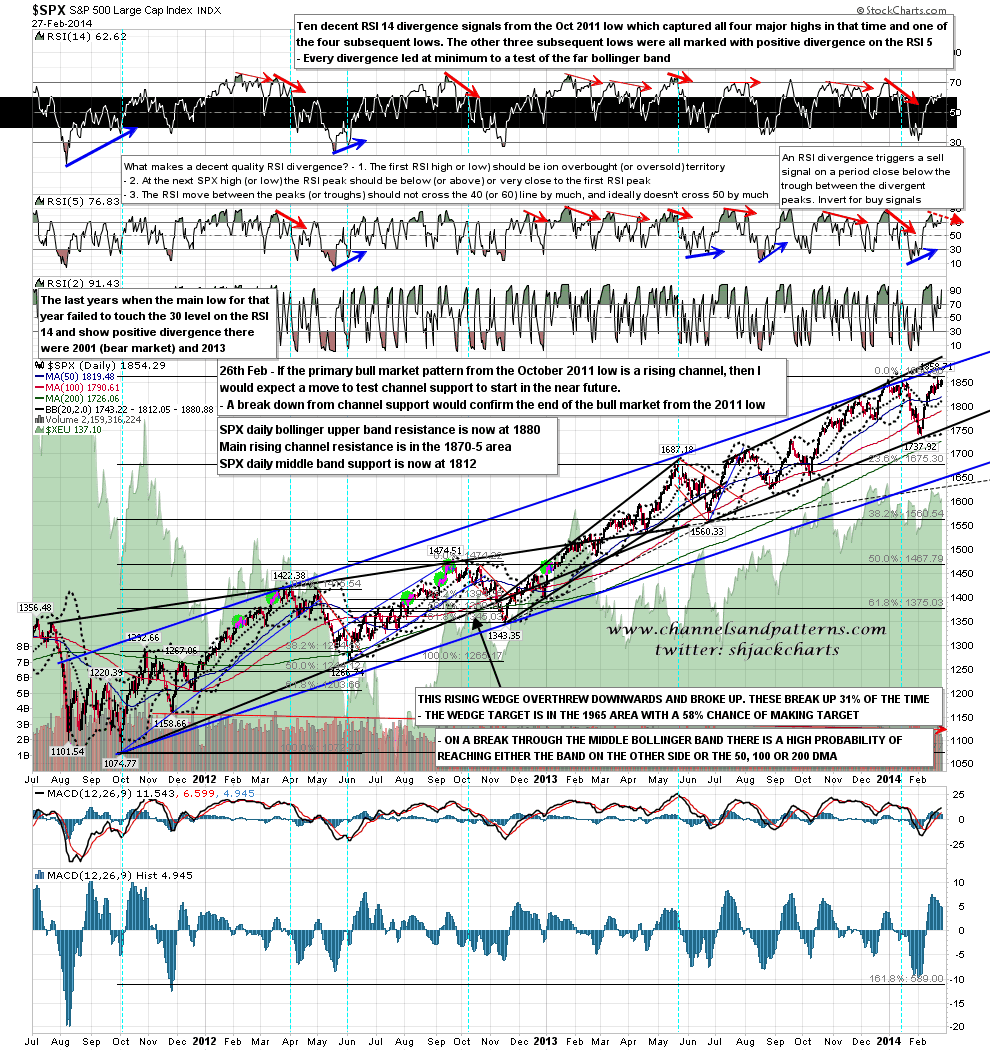
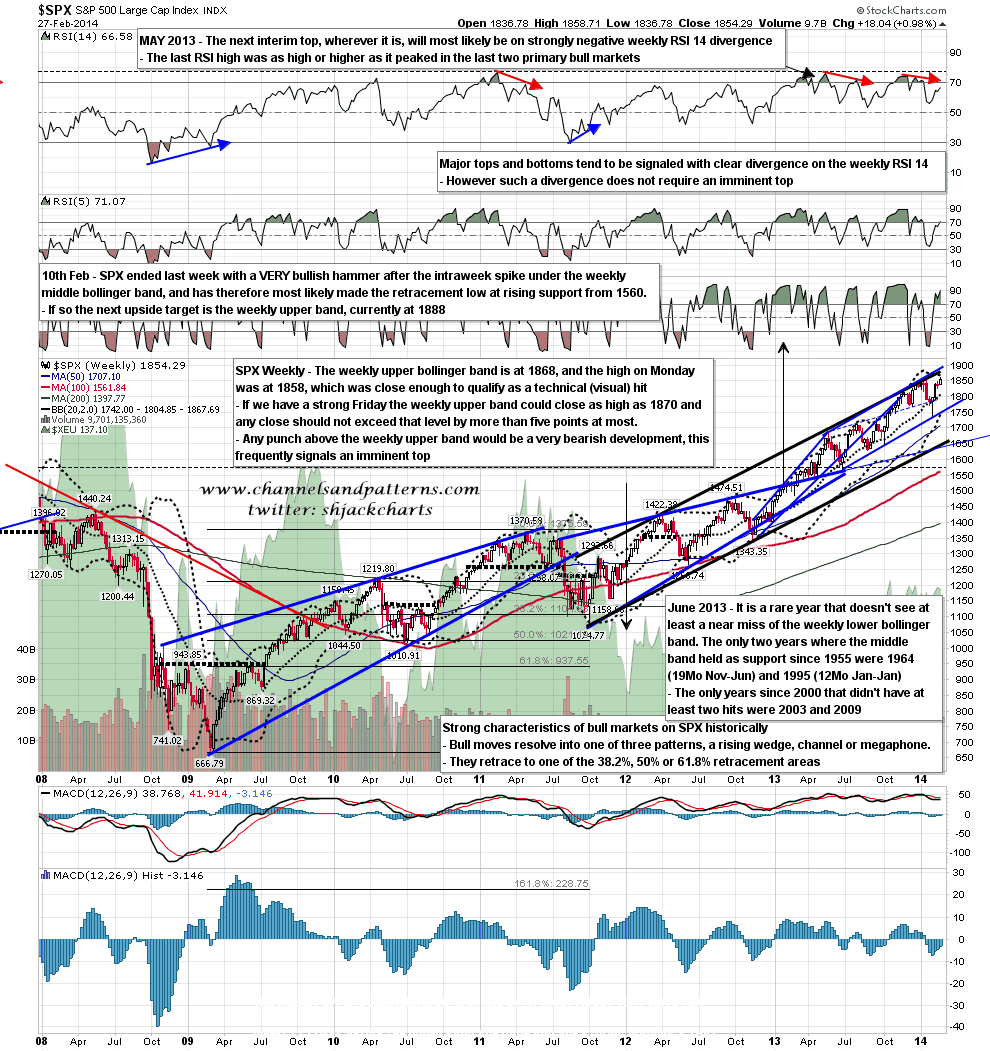
If we see a move that extends over the current SPX high more than marginally today then I have two resistance levels overhead that should cap any move today, and possibly for some months to come, and the first of those is rising channel resistance from the October 2011, currently in the 1870-5 area. If this is indeed the primary pattern for the current bull market then that will be very solid resistance. There is a possibility however that I am mistaken and I’ll look at this again if we see a clear break above there. SPX daily chart:
The second resistance level is the SPX weekly upper bollinger band. Punches over this are both rare and very bearish so I’m not expecting to see that here. The upper band was at 1868 at the close yesterday and if SPX has a strong day then that might close as high as 1870 today. With a wiggle room range of a further five points that again would put a likely ceiling today in the 1870-5 SPX range. SPX weekly chart:
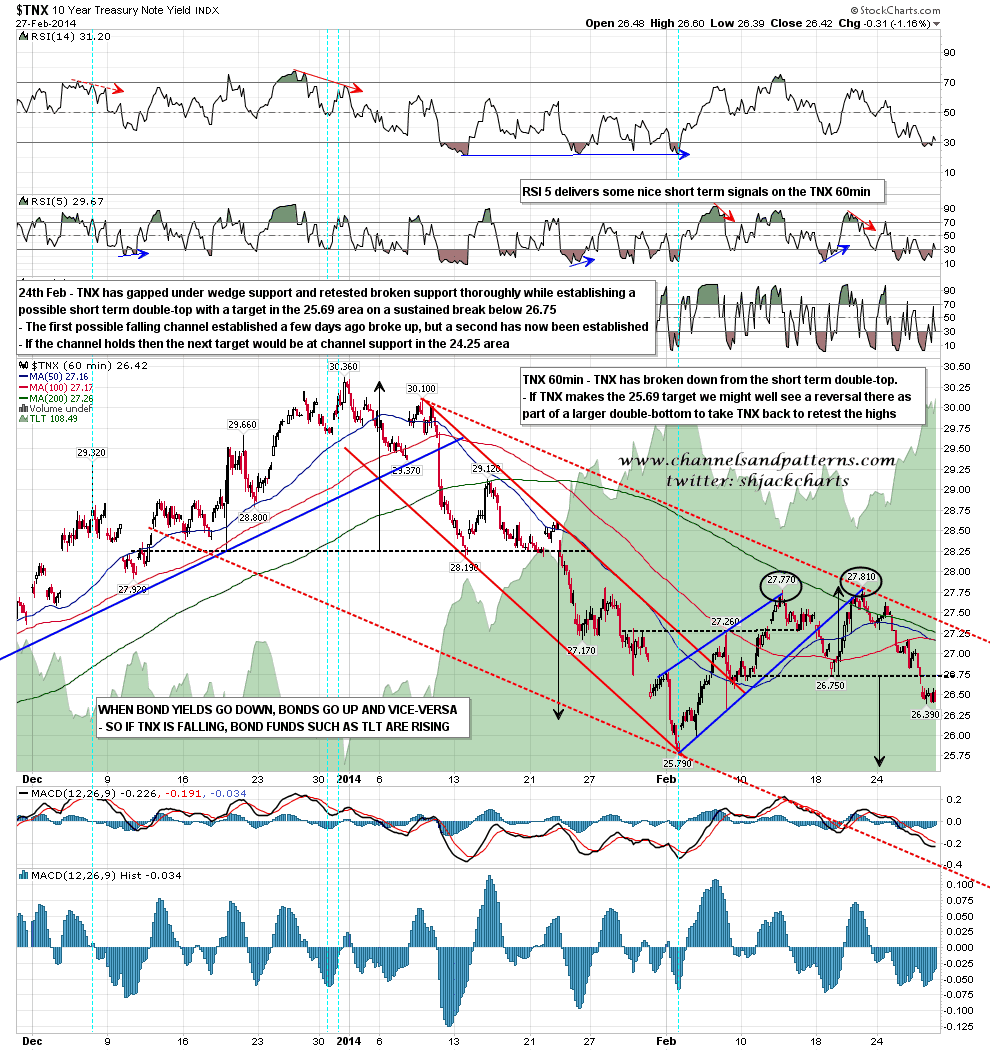
On other markets the TNX double-top has now definitely broken down with a target in the 25.69 area. I will be looking for a possible low in that area to set up a larger double-bottom that would effectively target a retest of the highs at the start of January. TNX 60min chart:
After yesterday’s breakup I’m still leaning long today and am expecting to see at least a marginal new high. If we see more than that then I have very strong resistance in the 1870-5 SPX range and I’d expect that to be a solid ceiling today. If we see a break over that at the close that would be a strongly bearish signal that would often signal that an important high has just been made, and should at minimum severely limit further upside for weeks to come. I will be doing a weekend post looking in detail at the 2011-1? cyclical bull market pattern setup as a follow-on to the charts I posted on Wednesday morning.
