
Predictions are tough to get right, but here’s one you can pretty much bank on: in 9 days, there will be stories galore about the Five Year Anniversary of the Bull Market. I’m sure I’ll chime in that day with something pithy (or pithyful).
Most of you have seen the two charts below in weeks past, particularly since they’ve been featured prominently and frequently in ZeroHedge, which makes a speciality of bad news of all stripes (be it government collapse, radiation, suicides, contaminated food, or the occasional financial meltdown):
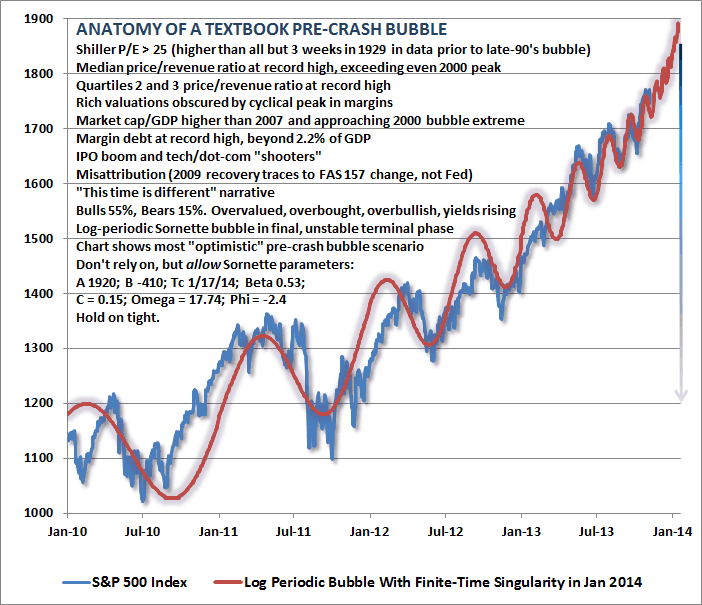
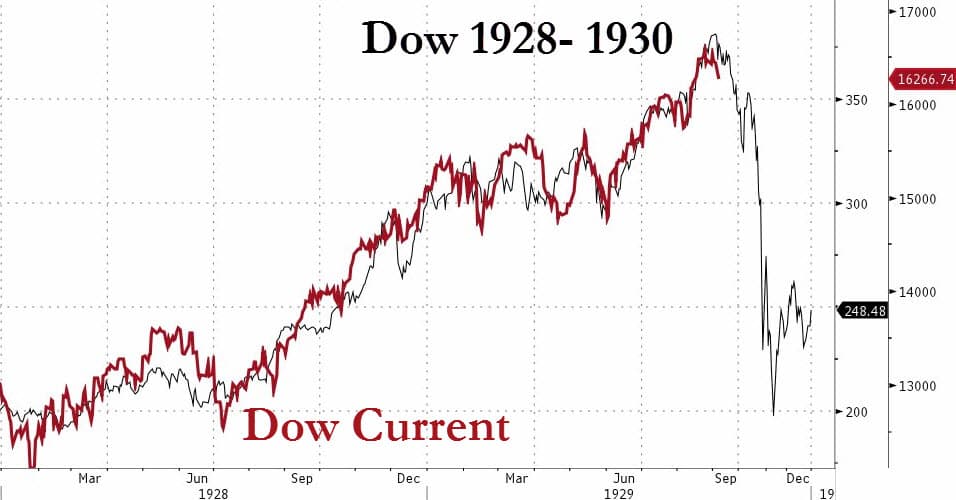
The thing is, though……….this stuff never comes true. Ever. I’ve been just as guilty of offering up compelling analogs and indicators (OK, ZH probably has me beat by a few hundred miles, but my hands are still unclean). The vicious thing about charts like these is that, even though the past 5,982 similar charts were dead wrong, they’re still terribly compelling.
I still have no doubt in my mind that a bear market would begin. The wildest bull on the planet would agree with that. Because trends change. The shocking thing is simply how long this bull run has persisted. If you had asked me in mid-2009 how high the market would go, I’d have speculated 1,000 on the S&P……..tops. Now that we’re nearly double that amount, and no amount of bad news can seem to shake the market from its precipice, the prospect of a sustained downtrend (“sustained” being more than thirteen minutes) seems ever more elusive.
Mean reversion is still a reality, however, and – – as has been uttered eight billion times by anyone with a microphone near them – – “this is going to end badly.” My view is that the severity of the “badly” is getting amplified as the day of reckoning gets pushed back by way of money-printing. But let’s face it………..after five years of waiting for Godot, it seems that the market has no reason not to keep going up for the rest of our days.
