
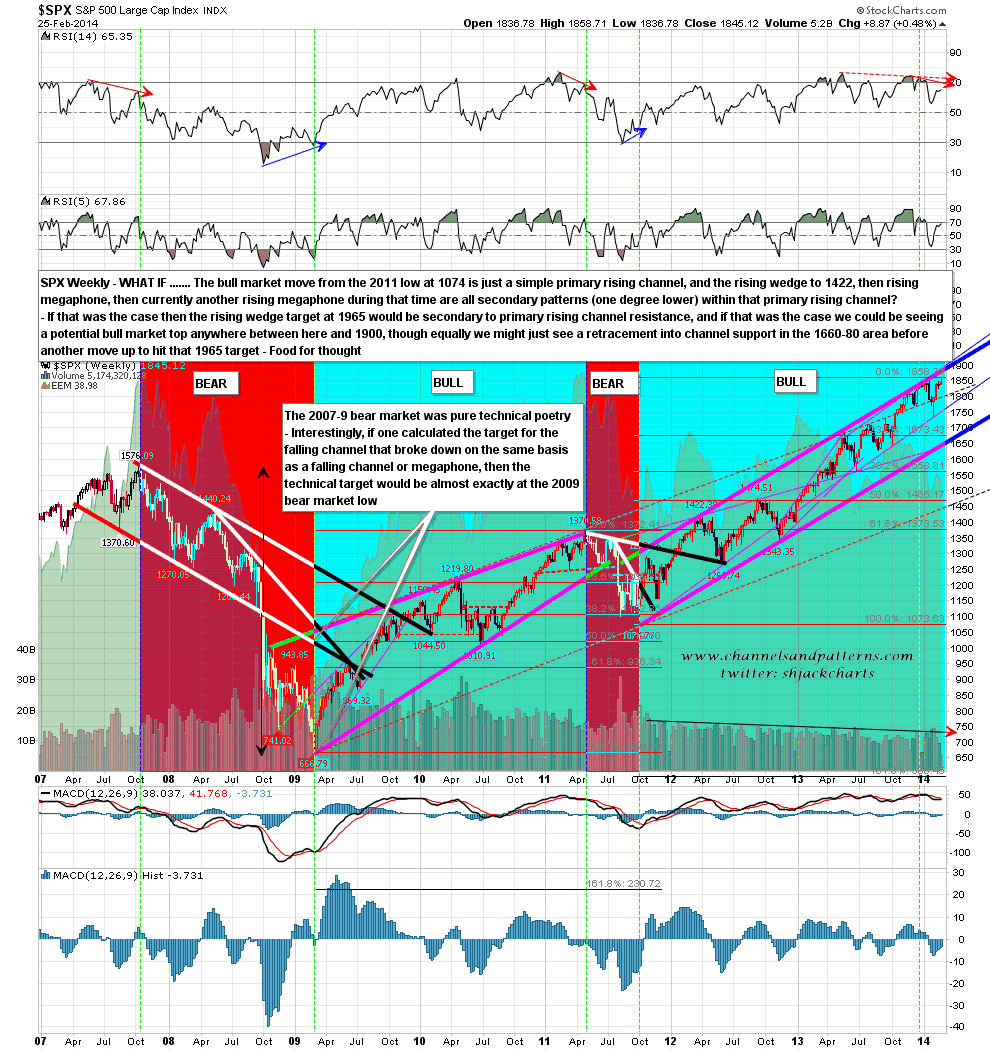
I took some time yesterday night to consider the overall bull market pattern setup here from the 2011 low. There is something that has been concerning me seriously on my weekly charts, and that is that I still have no pattern from the 1343 low, and the last low of course was very clearly on a trendline from the 1560 low. Why is that important? Well I’m going to do a post explaining my thinking here in detail at the weekend but suffice it to say for now that my wedge target at 1965 is a wedge target regardless of degree, but the reason I have been expecting the target to be reached is because my assumption has been that the rising wedge from the 2011 low from which that target is taken is a primary bull market pattern. If that was the case, then the following primary bull market pattern should start from 1343, and I can only see a secondary (one degree below) pattern starting there. If that pattern is a secondary pattern, then most likely the rising wedge from the 2011 low was also a secondary pattern.
I did a post on 29th June last year detailing my theory about patterns in bull markets on SPX, and you can see that post here. For now I’ll just say that there must be a primary bull pattern from the 2011 low that is a rising wedge, channel or megaphone, and if the first rising wedge from there was a secondary pattern, then that pattern from October 2011 is very likely to be a rising channel, with channel resistance already hit at the 1850 high last month. That would put SPX in a topping process here and we currently have a very nice looking double-top in place, though the second high could still extend a little higher.
I have charted the last seven years of bull and bear markets on the SPX weekly chart and have marked up this revised take on the chart. Primary patterns and trendlines are marked with the thick trendlines. If you love a great chart you should also take a moment to study the pure technical poetry of the 2007-9 bear market. SPX weekly chart:
I have amended my daily chart to show this rising channel and you can see that channel resistance would still only be in the 1870 area. The SPX daily upper bollinger band is now at 1871 with the weekly upper band now at 1866. On this analysis I would be surprised to see SPX go significantly higher than 1870, and the next obvious target would be rising channel support in the 1660-80 area, depending on the time taken to hit it. As an aside I have had a few questions recently about how I use RSI divergences and I have marked up a clear explanation of how I do that at the top of this chart. SPX daily chart:

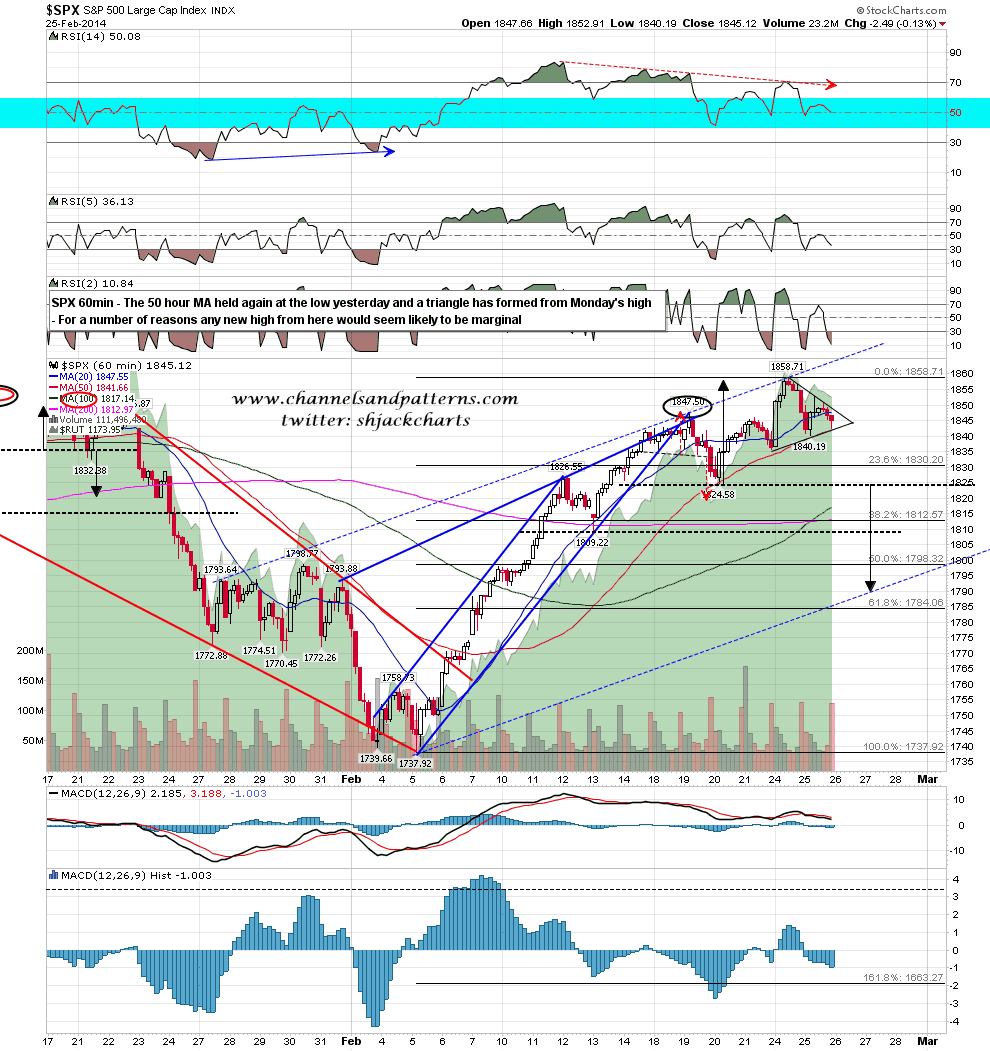
Back in the short term I posted a triangle that had formed on SPX yesterday afternoon and have marked that up on my 60min chart. I said yesterday morning that the most important support level to watch was the 50 hour MA and it was tested again, and held again. As long as that remains the case SPX may well retest the current high or make a marginal new high. The 50 hour MA closed at 1841.66 yesterday. SPX 60min chart:
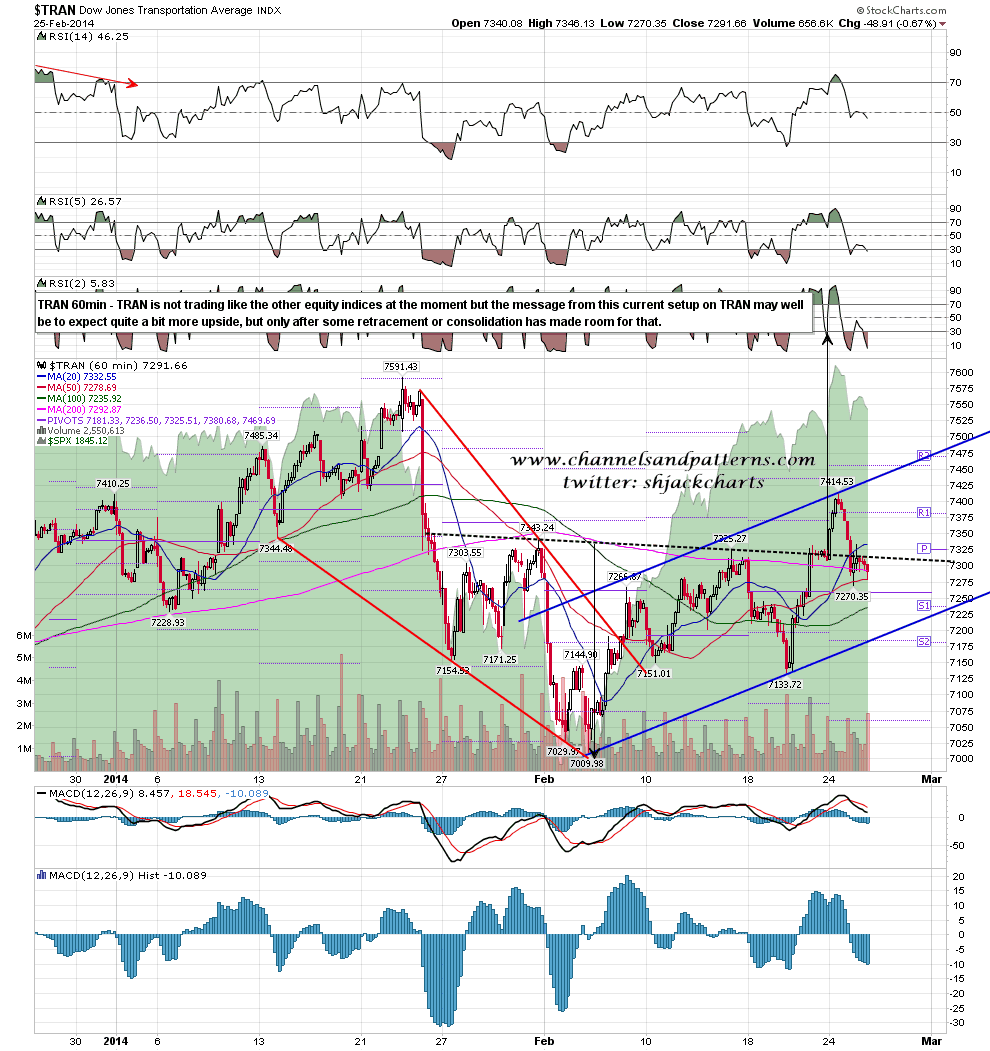
I was looking at the TRAN chart yesterday morning and TRAN has now retraced halfway to channel support. That leans rather more bearish than ES does this morning. TRAN 60min chart:
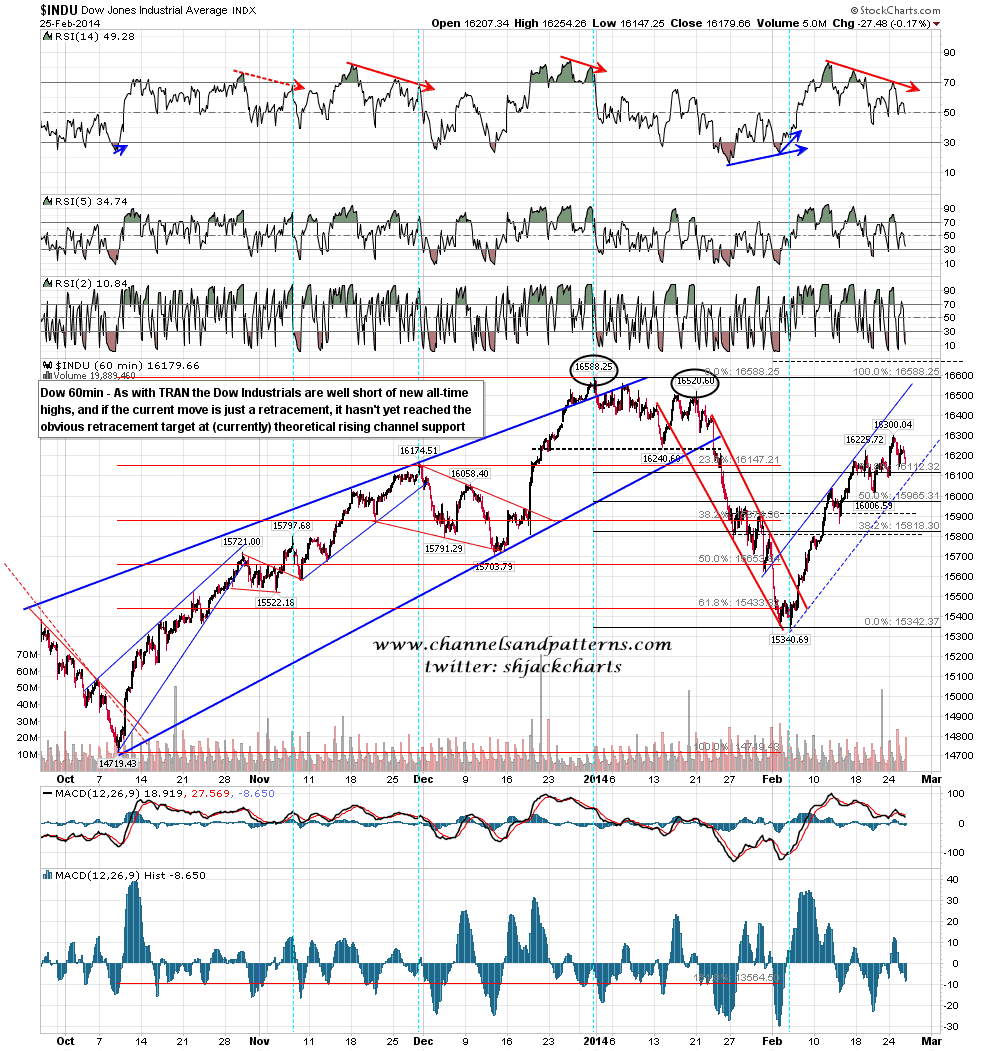
There is a not that dissimilar setup on Dow, and again the obvious short term target looks a bit lower. As with TRAN Dow has been lagging SPX badly and is not close to making a new all time high. Dow 60min chart:
On other markets I’ve been reading quite a few comments that bonds are likely to reverse back down hard shortly. As yet I’m not seeing any sign of that on the (inverse to bonds) TNX 60min chart, where the very nice looking short term double-top that I’ve been looking at is continuing to form, and that has a target at a retest of the current 2014 low on a sustained break under 26.75. TNX 60min:

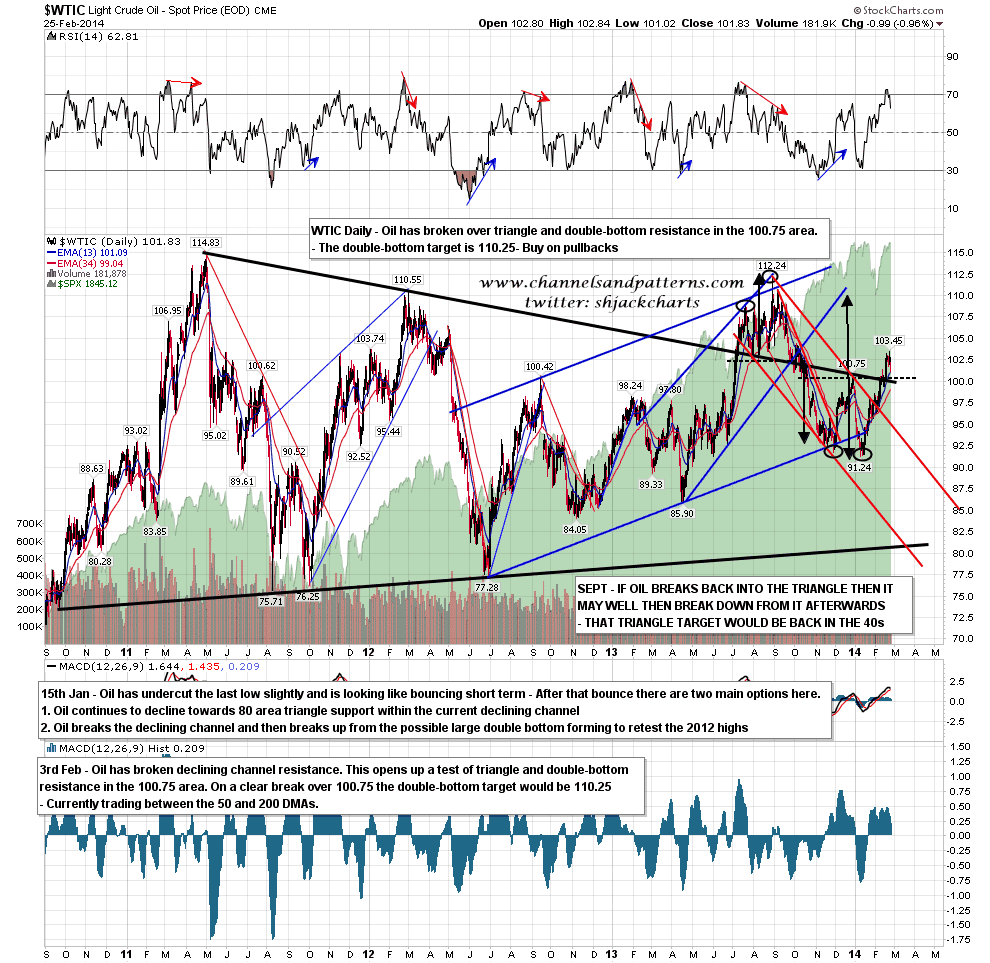
I won’t look at gold today as I’m short on space and gold is heading upwards as expected. On oil we are seeing a retest of broken double-bottom resistance and as long as that holds the double-bottom target is eight hundred and fifty pips or so higher at 110.25. WTIC daily chart:
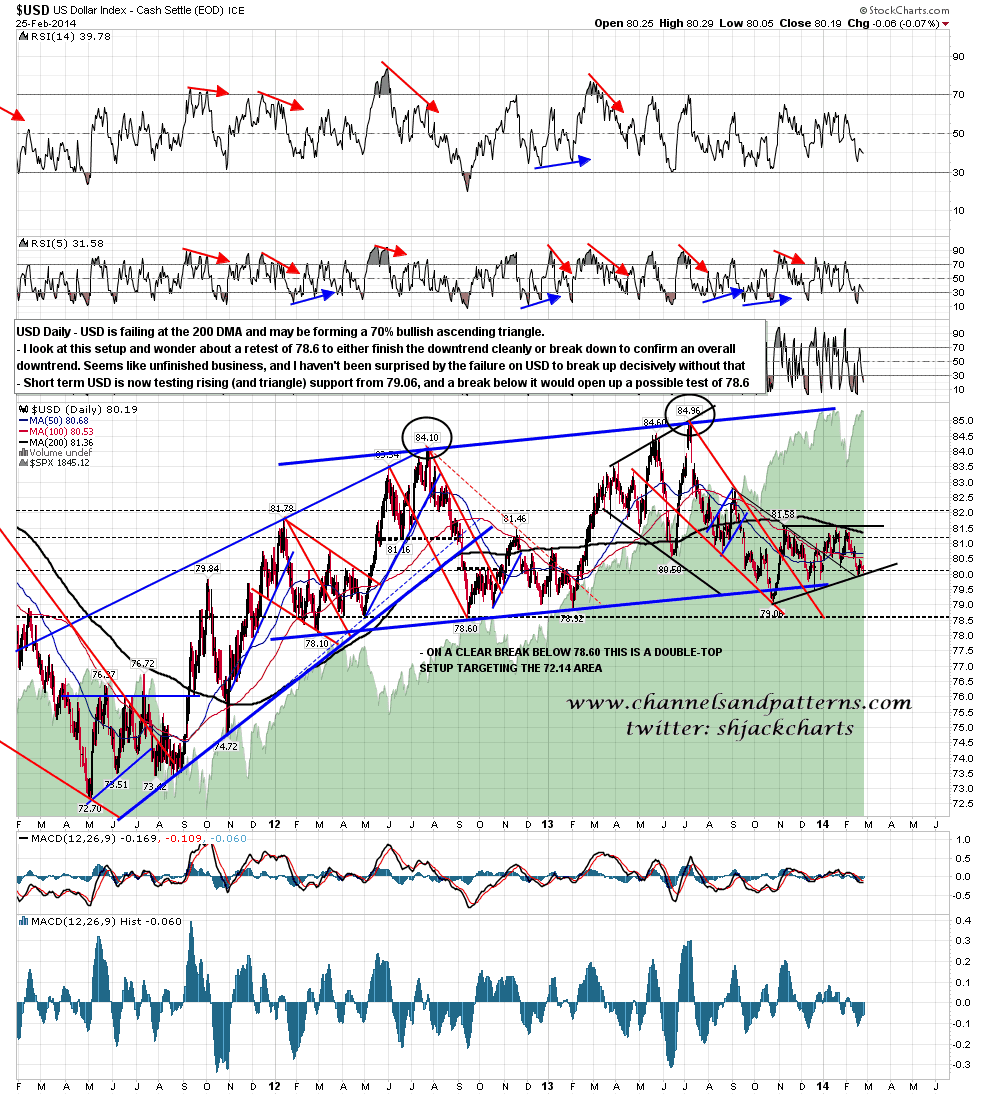
USD bounced at (70% bullish) ascending triangle support the other day and looks likely to retest that. It’s always worth remembering that a 70% bullish pattern will break down 30% of the time. When you factor in the false breaks that are seen so often on triangles that figure may be higher than 50%, though in the latter case the break would be quickly reversed of course. USD daily chart:
The two important support levels to watch on ES/SPX today are the ES 50 hour MA, now at 1846.75, and the SPX 50 hour MA, which closed yesterday at 1841.7. If ES 50 HMA support breaks then bulls have to hold the SPX 50 HMA level on an hourly closing basis. If we see an hourly close under 1840 SPX I’l be assuming that SPX will go lower, and very possibly a lot lower.
Apologies for the long eight chart post today. I’ve been trying to keep these morning posts down to five or six charts but there’s just a lot to get through today as I felt that under the circumstances my revised take on the current primary bull market setup couldn’t wait until the weekend. My previous take with the short term target at 1965 is now my primary alternate take, on the assumption either that the pattern from 1343 is just taking an unusually long time to become clear, or that I need to amend my view on primary patterns to allow a secondary joining pattern between primary patterns.
