
Strong support in the 1870 area was established on ES yesterday, and added to that as support this morning are the hourly lower band at 1871 and the hourly 50 MA at 1872. Resistance at 1877.5 has been strong overnight. I’m leaning bullish today and expect that 1877.50 ES resistance will most likely be broken.
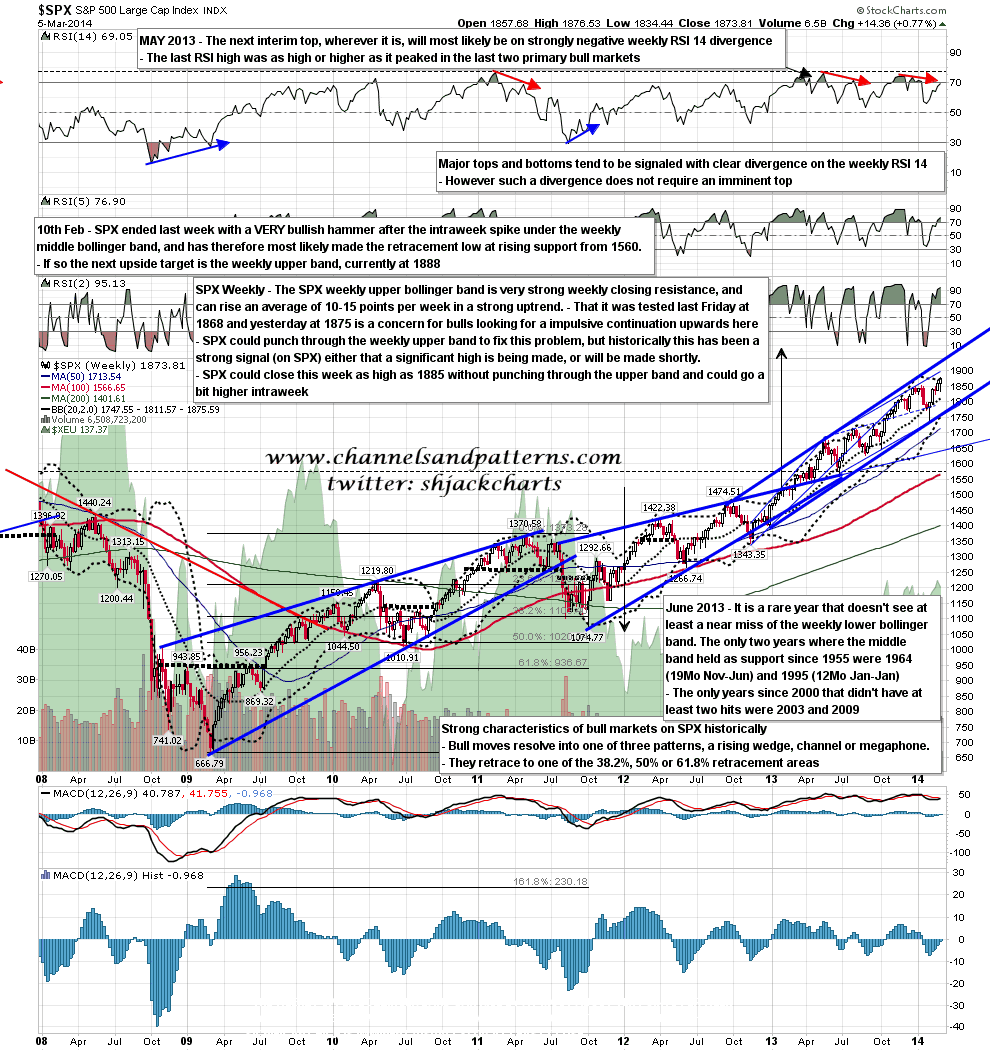
Overhead resistance for this week is at the SPX weekly upper bollinger band, currently at 1876, but I’d estimate that there’s room for a close tomorrow up to 1885 SPX without a rare and very bearish punch over the upper band. SPX weekly chart:
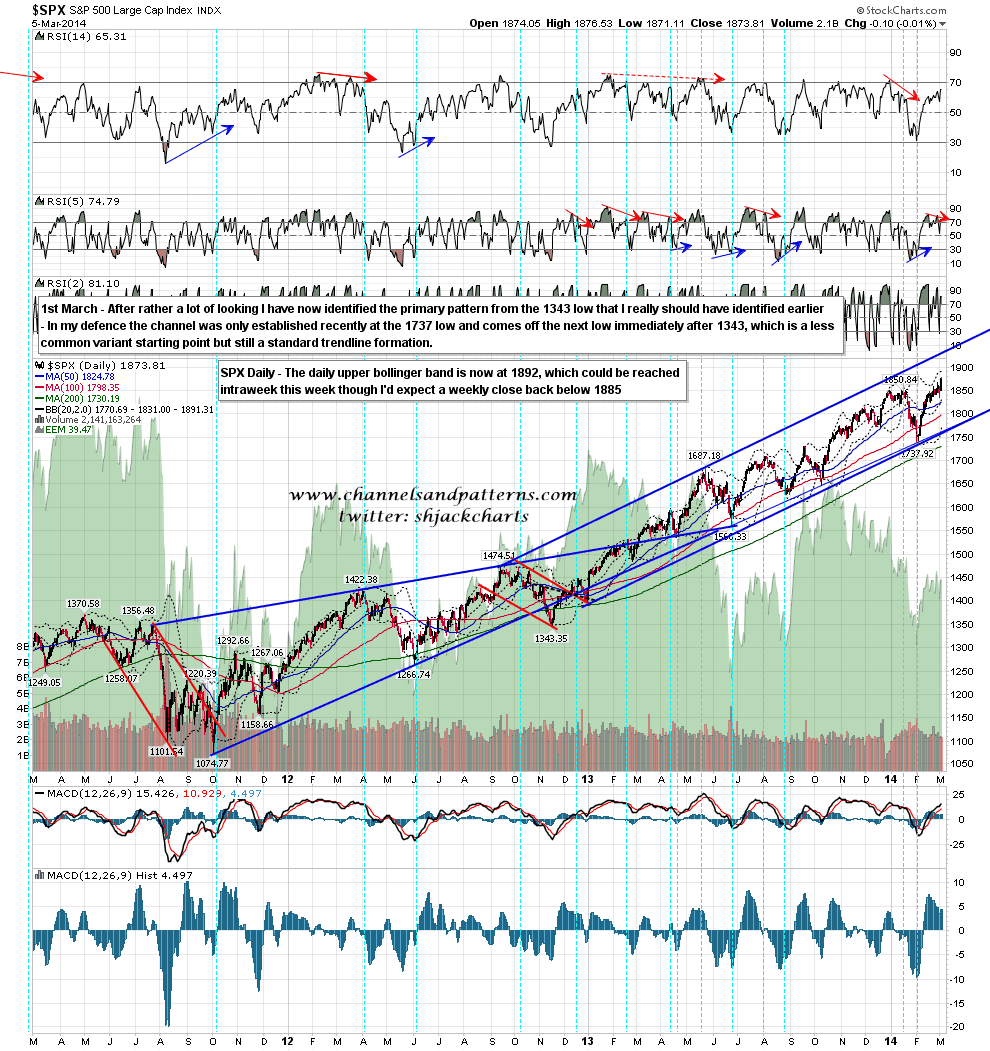
On the daily chart the upper band is now at 1891 and we could see that hit on an intraday move up. SPX daily chart:
On the 60min chart I have a resistance trendline with resistance in the 1795 area, and that is a possible target that would ft with the daily upper band. SPX 60min chart:
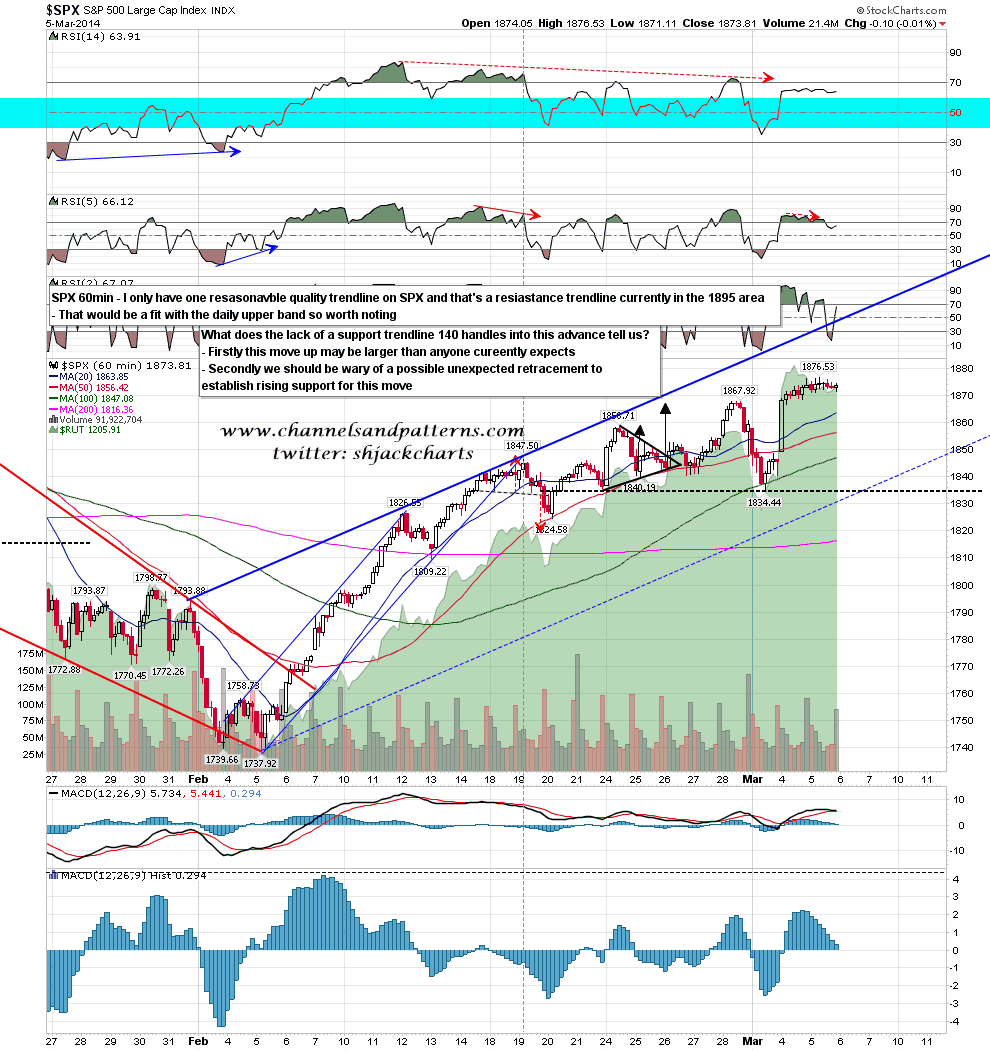
What does it mean that there is no established support trendline on the SPX chart 140 points into the current move? Well firstly that would suggest that this move may well turn out to be much larger than anyone currently expects. Secondly there is a real risk that we will have a poorly anticipated retracement to establish that rising support trendline.
Posts will be back at normal length and breadth tomorrow.
