
SPX made some progress towards the double-bottom target at 1873 on Thursday. That is in effect a retest of the last rally high at 1872.53 and is the last serious resistance between SPX and a test of the current highs. SPX 60min chart:

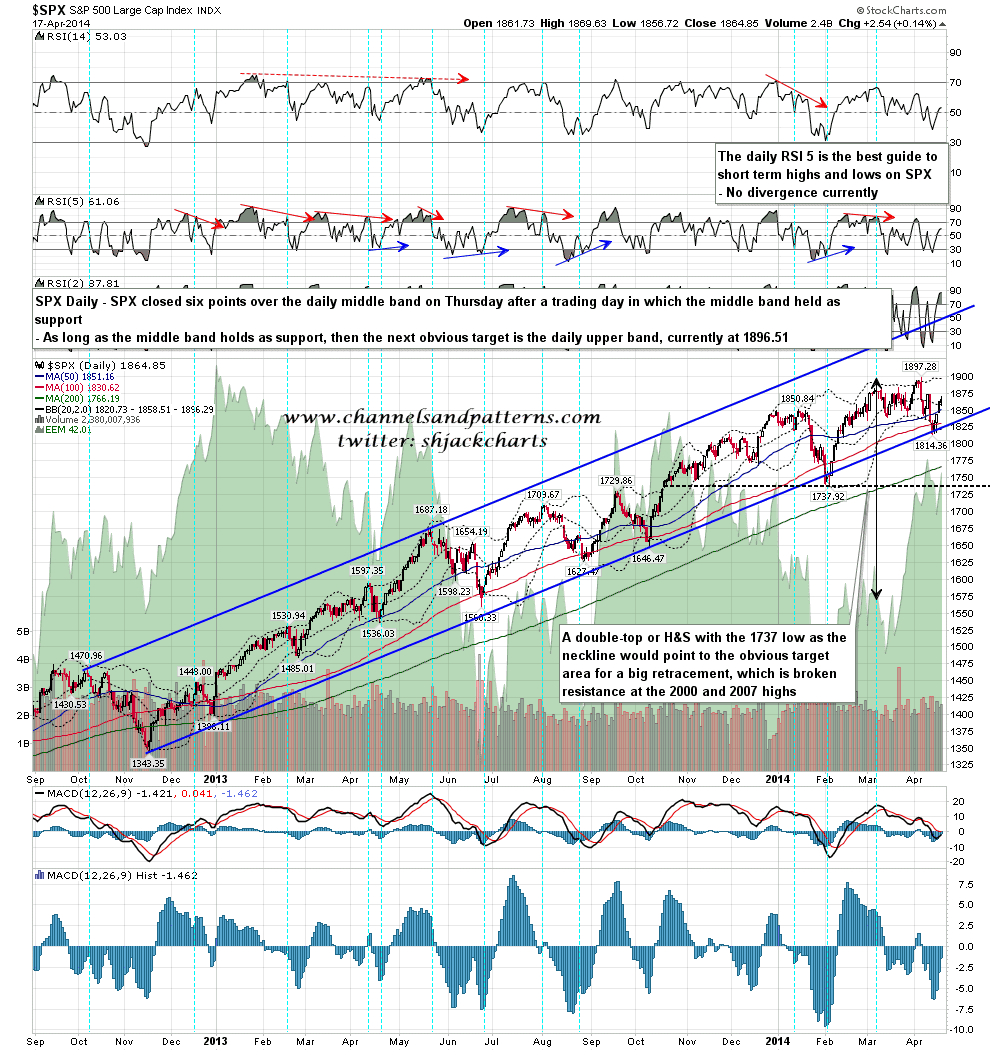
Though the gain on Friday was modest the bull case still strengthened somewhat as SPX closed six points above the middle band after a day where the middle band held as support. SPX daily chart:
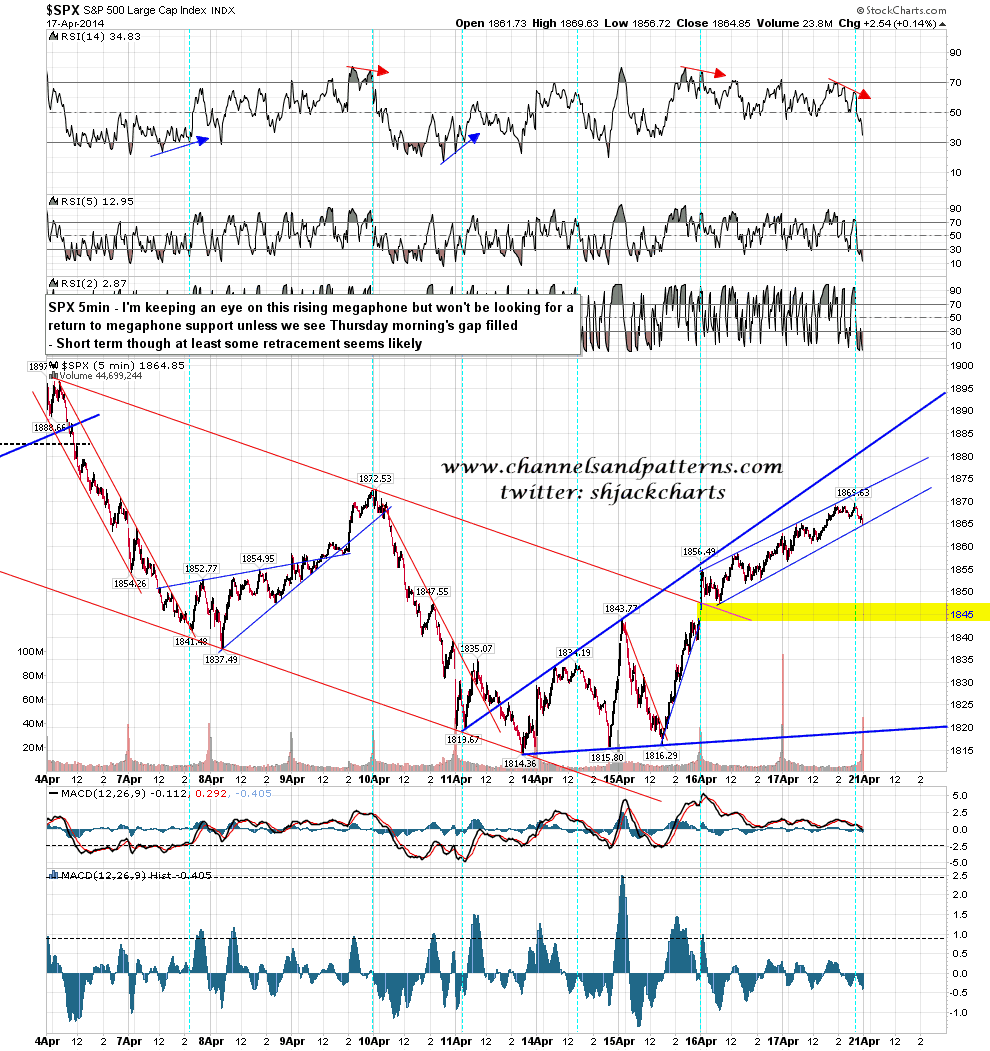
Looking at the rising megaphone on the 5min chart I won’t be looking for a retracement to megaphone support unless the opening gap from Wednesday morning is filled. Short term though this chart seems to be looking for a bit of retracement. SPX 5min chart:
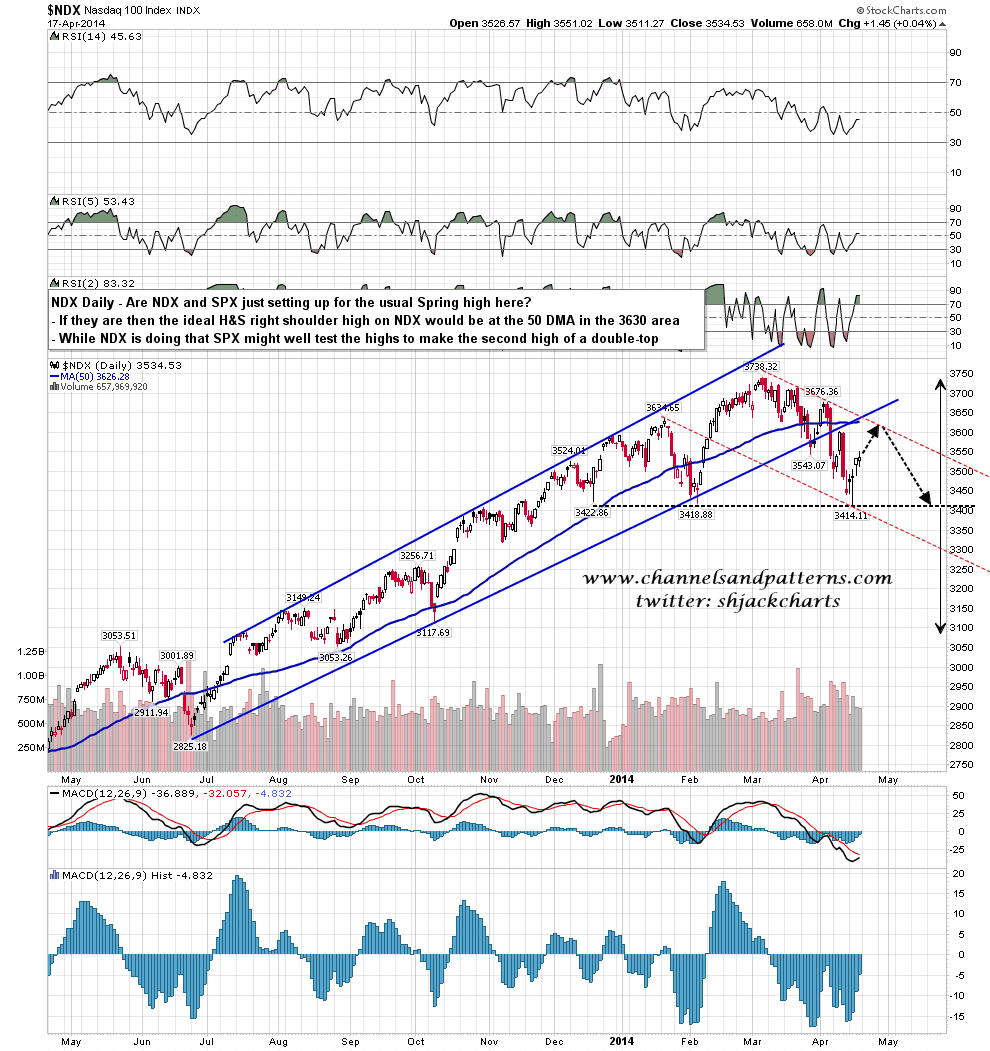
So what happens if bulls take out the last rally high and break towards a test of the current highs? Well that could be the start of a new bull wave up, but we might just be seeing SPX make the second high of a double-top as part of the usual Spring high. For that setup I won’t be watching the SPX as much as NDX, as there is a very nice H&S forming there, and the ideal right shoulder high would be in the 3630 area, very close to significant resistance at the 50 DMA, currently at 3626. If NDX reverses hard near there then the retracement on SPX since the start of April has just been a warm-up for the main summer decline. NDX daily chart:
For today I’ll be watching support at the SPX middle band in the 1858 area and resistance at the last rally high at 1872.53. I’m not expecting to see a big move but could be mistaken.
